Answered step by step
Verified Expert Solution
Question
1 Approved Answer
Can you explain how I would do this in matlab and show the steps to it also if I will comment the first couple of

Can you explain how I would do this in matlab and show the steps to it also if I will comment the first couple of numbers can you show how you would hypothetically load the dat?
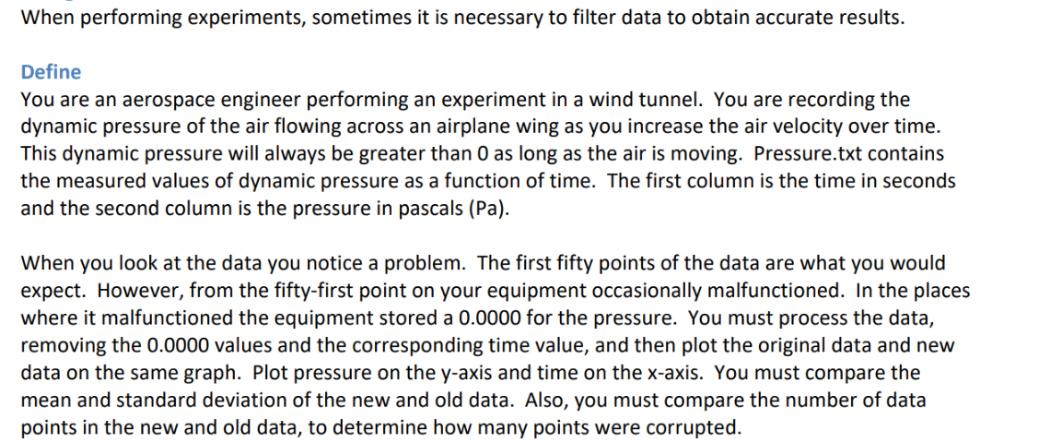
When performing experiments, sometimes it is necessary to filter data to obtain accurate results. Define You are an aerospace engineer performing an experiment in a wind tunnel. You are recording the dynamic pressure of the air flowing across an airplane wing as you increase the air velocity over time. This dynamic pressure will always be greater than 0 as long as the air is moving. Pressure.txt contains the measured values of dynamic pressure as a function of time. The first column is the time in seconds and the second column is the pressure in pascals (Pa). When you look at the data you notice a problem. The first fifty points of the data are what you would expect. However, from the fifty-first point on your equipment occasionally malfunctioned. In the places where it malfunctioned the equipment stored a 0.0000 for the pressure. You must process the data, removing the 0.0000 values and the corresponding time value, and then plot the original data and new data on the same graph. Plot pressure on the y-axis and time on the x-axis. You must compare the mean and standard deviation of the new and old data. Also, you must compare the number of data points in the new and old data, to determine how many points were corrupted.
Step by Step Solution
There are 3 Steps involved in it
Step: 1
Certainly Heres how you can accomplish this task in MATLAB 1 Load the Data You can load the data fro...
Get Instant Access to Expert-Tailored Solutions
See step-by-step solutions with expert insights and AI powered tools for academic success
Step: 2

Step: 3

Ace Your Homework with AI
Get the answers you need in no time with our AI-driven, step-by-step assistance
Get Started


