Answered step by step
Verified Expert Solution
Question
1 Approved Answer
Can you give me a breakdown of the actual formulas within excel to use for this? ie. MAD/MAPE/CFE/Tracking Signal? In a breakdown like: showing me

Can you give me a breakdown of the actual formulas within excel to use for this? ie. MAD/MAPE/CFE/Tracking Signal? In a breakdown like: showing me CELL P7 is from: Formula =AVERAGE(A1:A5) or AVEDEV(A1:5) etc..
I also do not understand where to add the .2 and .4 in the excel for this? I would appreciate your breakdown for me, thank you for your time and assistance.
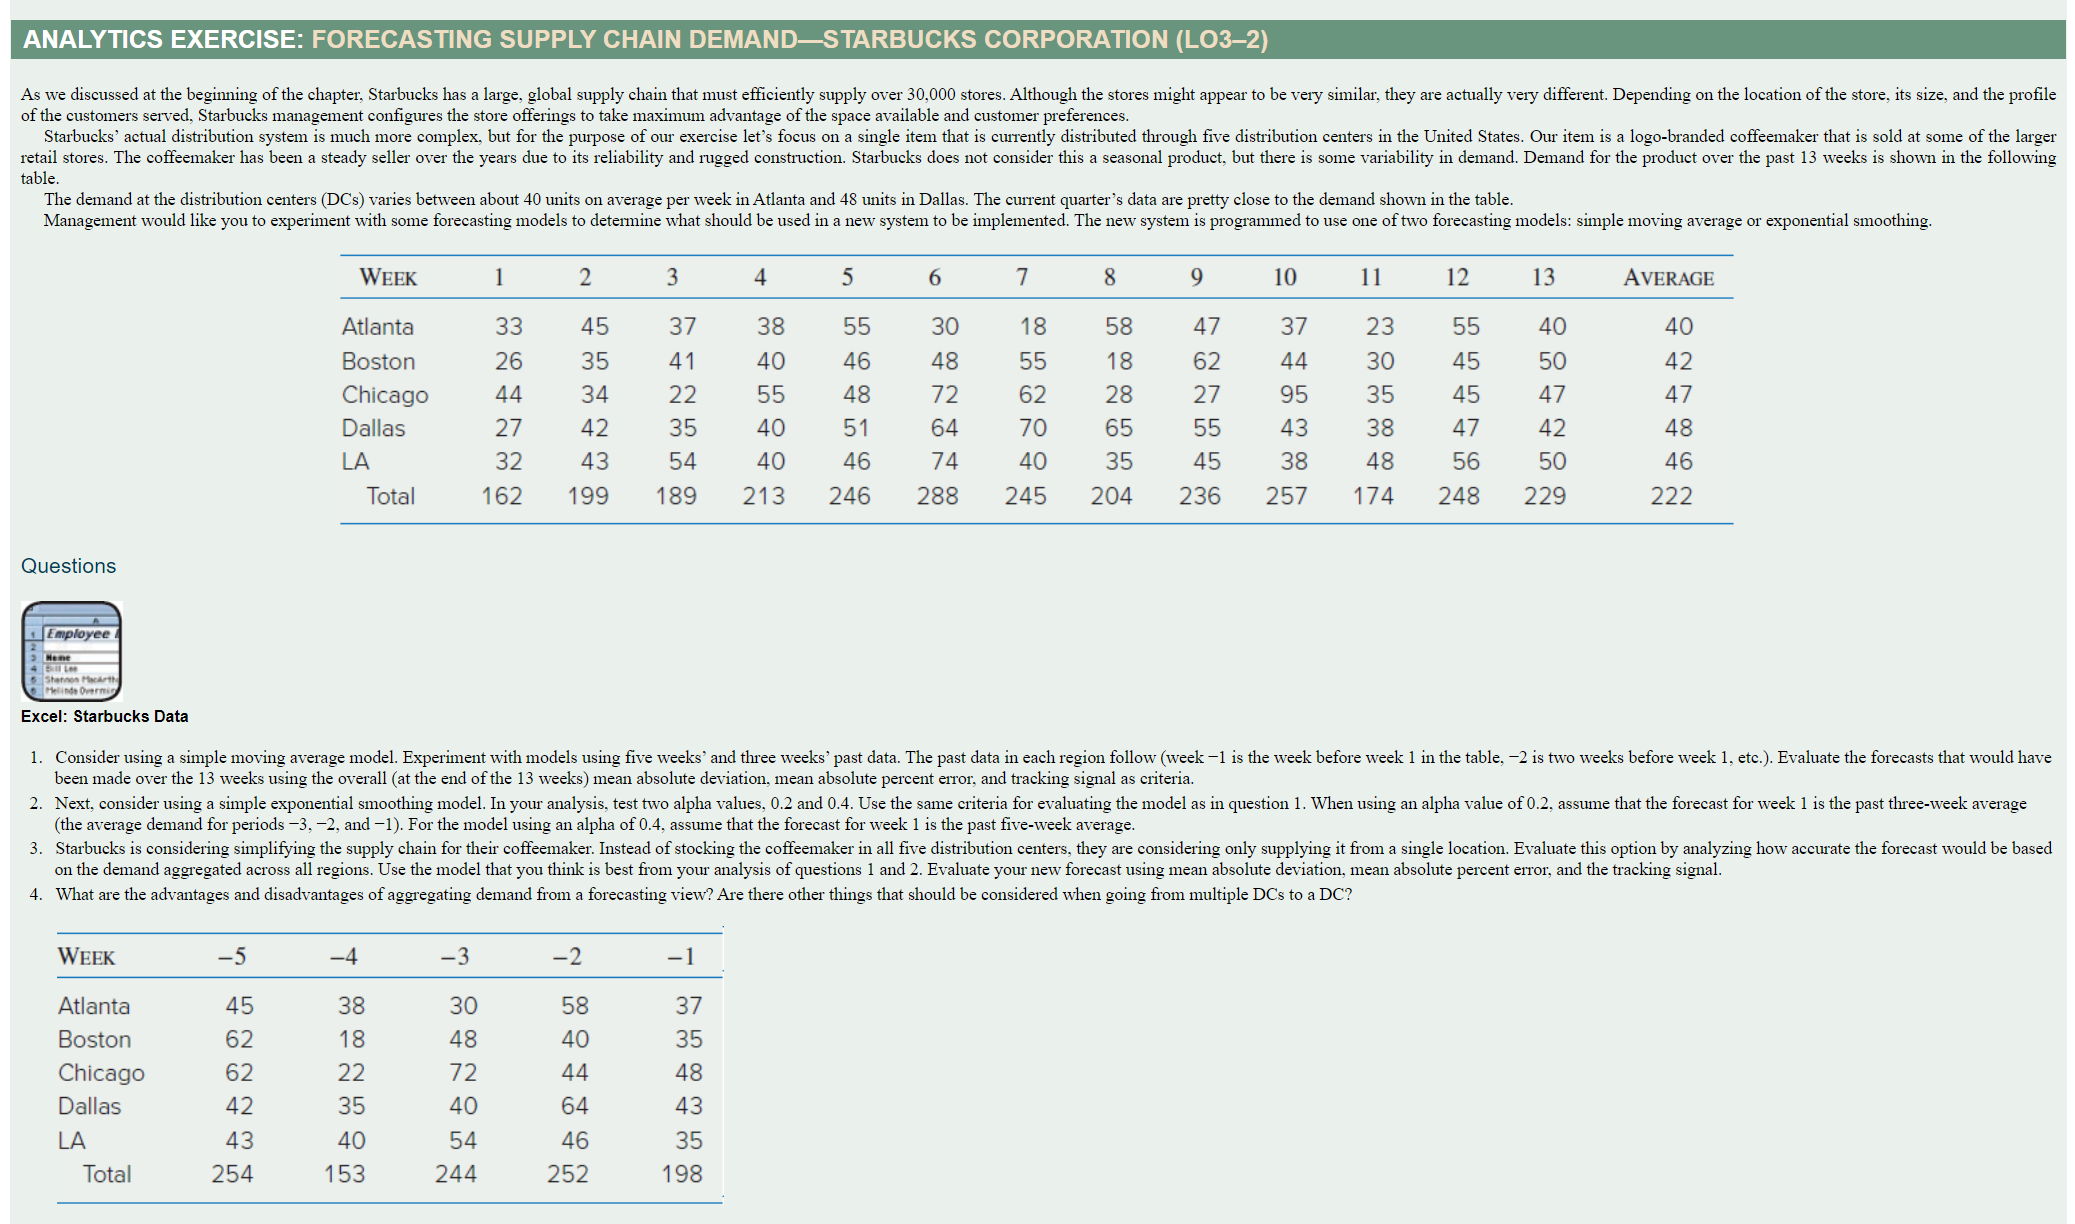
ANALYTICS EXERCISE: FORECASTING SUPPLY CHAIN DEMAND-STARBUCKS CORPORATION (LO3-2) of the customers served, Starbucks management configures the store offerings to take maximum advantage of the space available and customer preferences. table. \begin{tabular}{|c|c|c|c|c|c|c|c|c|c|c|c|c|c|c|} \hline WEEK & 1 & 2 & 3 & 4 & 5 & 6 & 7 & 8 & 9 & 10 & 11 & 12 & 13 & AVERAGE \\ \hline Atlanta & 33 & 45 & 37 & 38 & 55 & 30 & 18 & 58 & 47 & 37 & 23 & 55 & 40 & 40 \\ \hline Boston & 26 & 35 & 41 & 40 & 46 & 48 & 55 & 18 & 62 & 44 & 30 & 45 & 50 & 42 \\ \hline Chicago & 44 & 34 & 22 & 55 & 48 & 72 & 62 & 28 & 27 & 95 & 35 & 45 & 47 & 47 \\ \hline Dallas & 27 & 42 & 35 & 40 & 51 & 64 & 70 & 65 & 55 & 43 & 38 & 47 & 42 & 48 \\ \hline LA & 32 & 43 & 54 & 40 & 46 & 74 & 40 & 35 & 45 & 38 & 48 & 56 & 50 & 46 \\ \hline Total & 162 & 199 & 189 & 213 & 246 & 288 & 245 & 204 & 236 & 257 & 174 & 248 & 229 & 222 \\ \hline \end{tabular} Questions Excel: Starbucks Data been made over the 13 weeks using the overall (at the end of the 13 weeks) mean absolute deviation, mean absolute percent error, and tracking signal as criteria. (the average demand for periods 3,2, and -1 ). For the model using an alpha of 0.4 , assume that the forecast for week 1 is the past five-week average. 4. What are the advantages and disadvantages of aggregating demand from a forecasting view? Are there other things that should be considered when going from multiple DCs to a DC? \begin{tabular}{lrrrrr} \hline WEEK & -5 & -4 & -3 & -2 & -1 \\ \hline Atlanta & 45 & 38 & 30 & 58 & 37 \\ Boston & 62 & 18 & 48 & 40 & 35 \\ Chicago & 62 & 22 & 72 & 44 & 48 \\ Dallas & 42 & 35 & 40 & 64 & 43 \\ LA & 43 & 40 & 54 & 46 & 35 \\ \multicolumn{1}{c}{ Total } & 254 & 153 & 244 & 252 & 198 \\ \hline \end{tabular}Step by Step Solution
There are 3 Steps involved in it
Step: 1

Get Instant Access to Expert-Tailored Solutions
See step-by-step solutions with expert insights and AI powered tools for academic success
Step: 2

Step: 3

Ace Your Homework with AI
Get the answers you need in no time with our AI-driven, step-by-step assistance
Get Started


