

Answered step by step
Verified Expert Solution
Question
1 Approved Answer
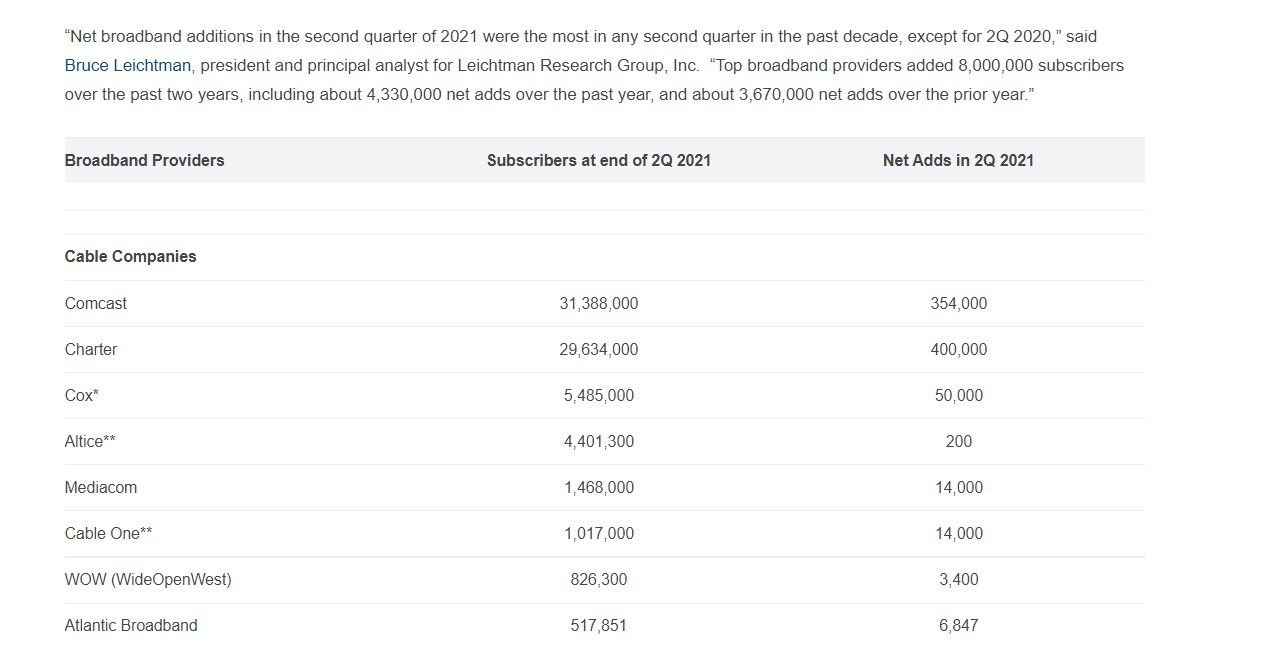
Can you help me draw a micoreconomics model to represent this information? (economic graph model) Net broadband additions in the second quarter of 2021 were
Can you help me draw a micoreconomics model to represent this information? (economic graph model)
Step by Step Solution
There are 3 Steps involved in it
Step: 1

Get Instant Access to Expert-Tailored Solutions
See step-by-step solutions with expert insights and AI powered tools for academic success
Step: 2

Step: 3
Ace Your Homework with AI
Get the answers you need in no time with our AI-driven, step-by-step assistance
Get Started
The Commanding Heights The Battle For The World Economy
Authors: Daniel Yergin, Joseph Stanislaw
1st Edition
068483569X, 9780684835693