can you help me please to find
1. Horizontal Analysis (Choose one of the statements).
2. Vertical Analysis (Choose one fo the statements)
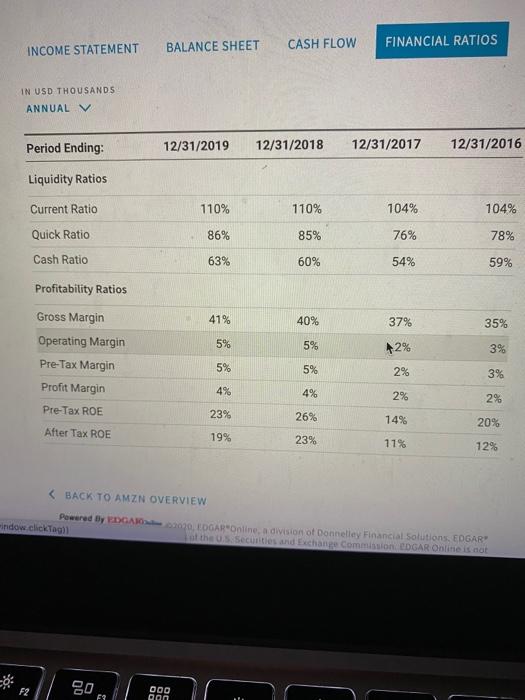
3. Ratio Analysis
*Current Ratio
*Inventory Turnover
*Working Capital
*Days Inventory in Hand
*Asset Turnover
3. Once you have completed your analysis, compose a 250-500 word document focusing on your option of the companys statement of financial position. Include in the response. Make sure your response is well organized and uses proper formatting.
amazon annual report or finaancials
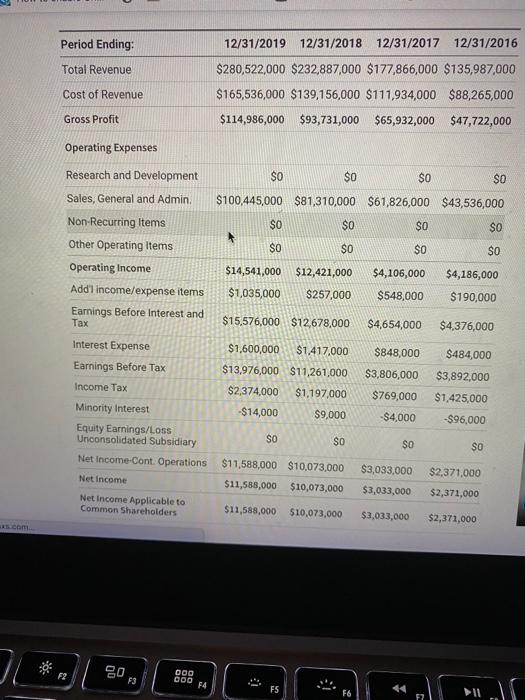
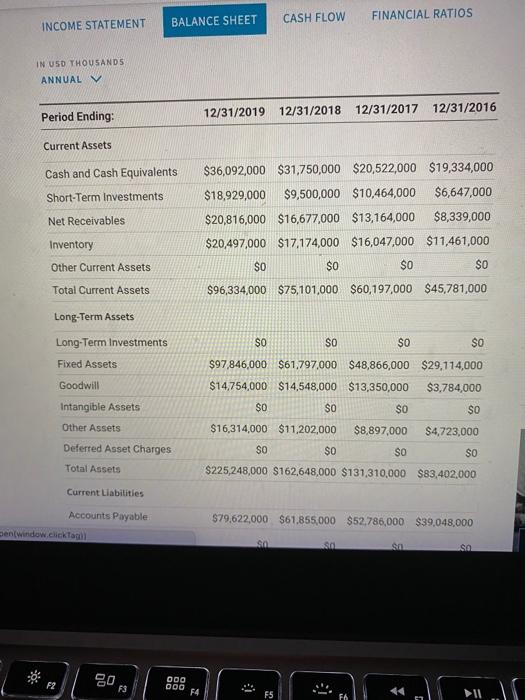
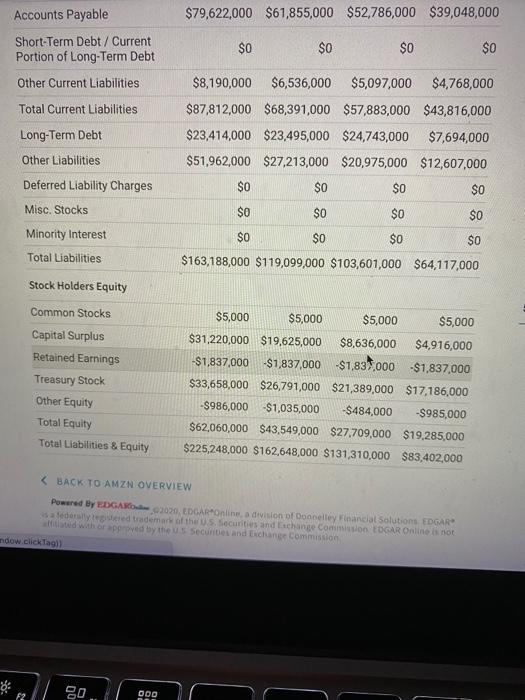
Period Ending: Total Revenue 12/31/2019 12/31/2018 12/31/2017 12/31/2016 $280,522,000 $232,887,000 $177,866,000 $135,987,000 $165,536,000 $139,156,000 $111.934,000 $88,265,000 $114,986,000 $93,731,000 $65,932,000 $47,722,000 Cost of Revenue Gross Profit Operating Expenses Research and Development Sales, General and Admin $0 $0 $0 SO $100,445,000 $81,310,000 $61,826,000 $43,536,000 $0 $0 $0 SO $0 $0 $0 SO Non-Recurring Items Other Operating Items $14,541,000 $12,421,000 Operating Income Add'l income/expense items $4,106,000 $548,000 $4,186,000 $190,000 $1,035,000 $257,000 Earnings Before Interest and Tax $15,576,000 $12,678,000 $4,654,000 $4,376,000 $848,000 Interest Expense Earnings Before Tax Income Tax $1,600,000 $1.417,000 $13,976,000 $11,261,000 $2,374,000 $1,197,000 -$14,000 $9,000 $3,806,000 $769,000 -$4,000 $484,000 $3,892,000 $1,425,000 -$96,000 Minority interest Equity Earnings/Loss Unconsolidated Subsidiary SO SO SO SO Net Income-Cont. Operations Net Income $11,588,000 $10,073,000 $11,588,000 $10,073,000 $3,033.000 $3,033,000 $2,371,000 $2,371,000 Net Income Applicable to Common Shareholders $11,588,000 $10,073,000 $3,033,000 $2,371,000 F2 80 F3 000 000 74 FS CASH FLOW FINANCIAL RATIOS INCOME STATEMENT BALANCE SHEET IN USD THOUSANDS ANNUAL Period Ending: 12/31/2019 12/31/2018 12/31/2017 12/31/2016 Current Assets Cash and Cash Equivalents Short-Term Investments Net Receivables Inventory $36,092,000 $31,750,000 $20,522,000 $19,334,000 $18,929,000 $9,500,000 $10,464,000 $6,647,000 $20,816,000 $16,677,000 $13,164,000 $8,339,000 $20,497,000 $17,174,000 $16,047,000 $11,461,000 Other Current Assets SO $0 $0 $0 $96,334,000 $75,101,000 $60,197,000 $45,781,000 Total Current Assets Long-Term Assets Long-Term Investments O SO $0 $0 Fixed Assets Goodwill Intangible Assets $97,846,000 $61,797,000 $48,866,000 $29,114,000 $14,754,000 $14,548,000 $13,350,000 $3,784,000 $0 SO SO SO $16,314,000 $11,202,000 $8,897,000 $4,723,000 SO $0 SO SO $225,248,000 $162,648,000 $131,310,000 $83,402.000 Other Assets Deferred Asset Charges Total Assets Current Liabilities Accounts Payable $79,622,000 $61,855,000 $52,786,000 $39,048,000 Senwindow.clickTagi so Sol so so F2 000 000 F3 F4 F5 $79,622,000 $61,855,000 $52,786,000 $39,048,000 Accounts Payable Short-Term Debt / Current Portion of Long-Term Debt $0 $0 $0 $0 Other Current Liabilities Total Current Liabilities Long-Term Debt Other Liabilities $8,190,000 $6,536,000 $5,097,000 $4,768,000 $87,812,000 $68,391,000 $57,883,000 $43,816,000 $23,414,000 $23,495,000 $24,743,000 $7,694,000 $51,962,000 $27,213,000 $20,975,000 $12,607,000 $0 $0 $0 $0 $0 $0 $0 $0 $0 $0 $0 $0 $163,188,000 $119,099,000 $103,601,000 $64,117,000 Deferred Liability Charges Misc. Stocks Minority Interest Total Liabilities Stock Holders Equity Common Stocks Capital Surplus Retained Earnings Treasury Stock Other Equity Total Equity Total Liabilities & Equity $5,000 $5,000 $5,000 $5,000 $31,220,000 $19,625,000 $8,636,000 $4,916,000 -$1,837,000 -$1,837,000 -$1,837,000 $1,837,000 $33,658,000 $26,791,000 $21,389,000 $17,186,000 -$986,000 -$1,035,000 -$484,000 -$985,000 $62,060,000 $43,549,000 $27709,000 $19,285,000 $225,248,000 $162,648,000 $131,310,000 $83,402,000