can you help me to answer those questions carefully? thumps up later. A number cube is rolled three times. An outcome is represented by a
can you help me to answer those questions carefully? thumps up later.
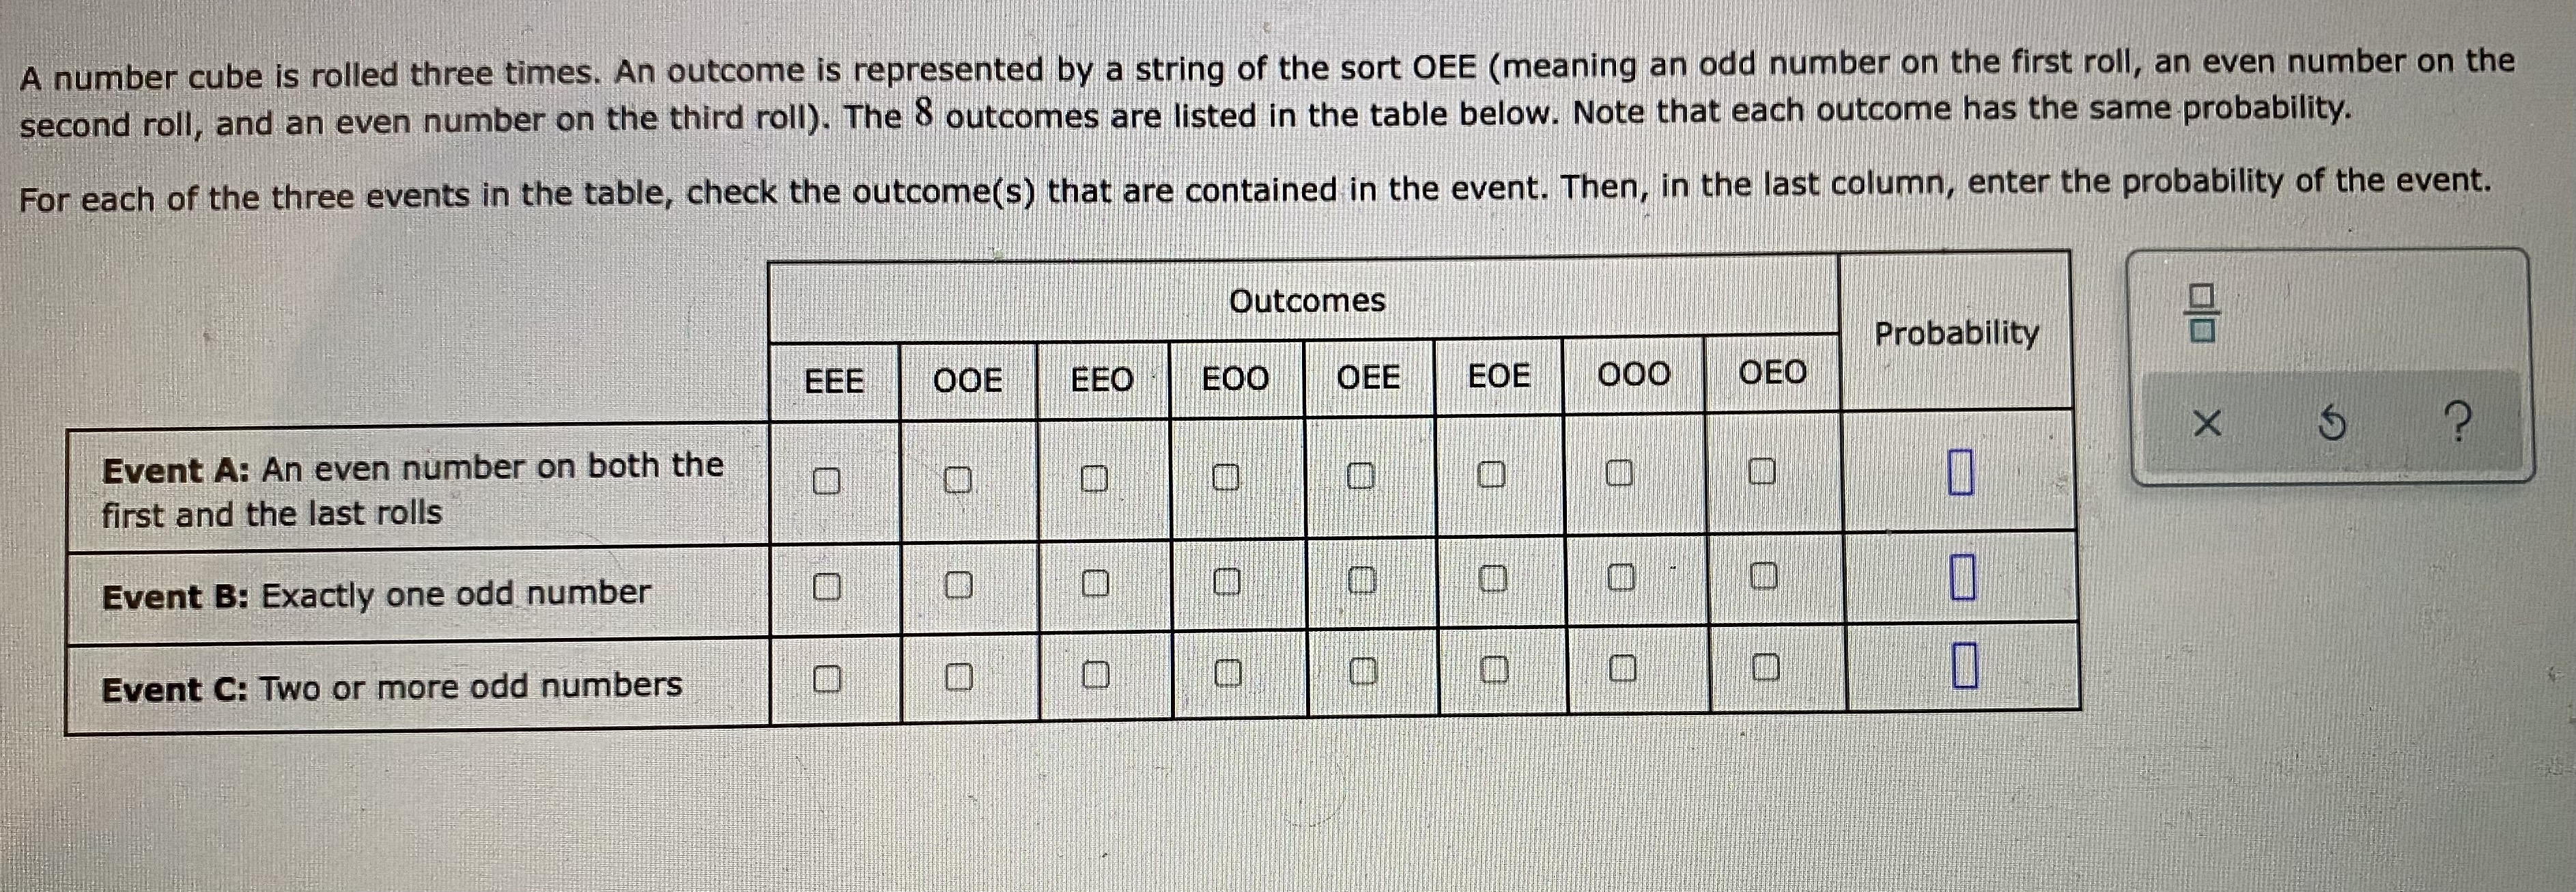
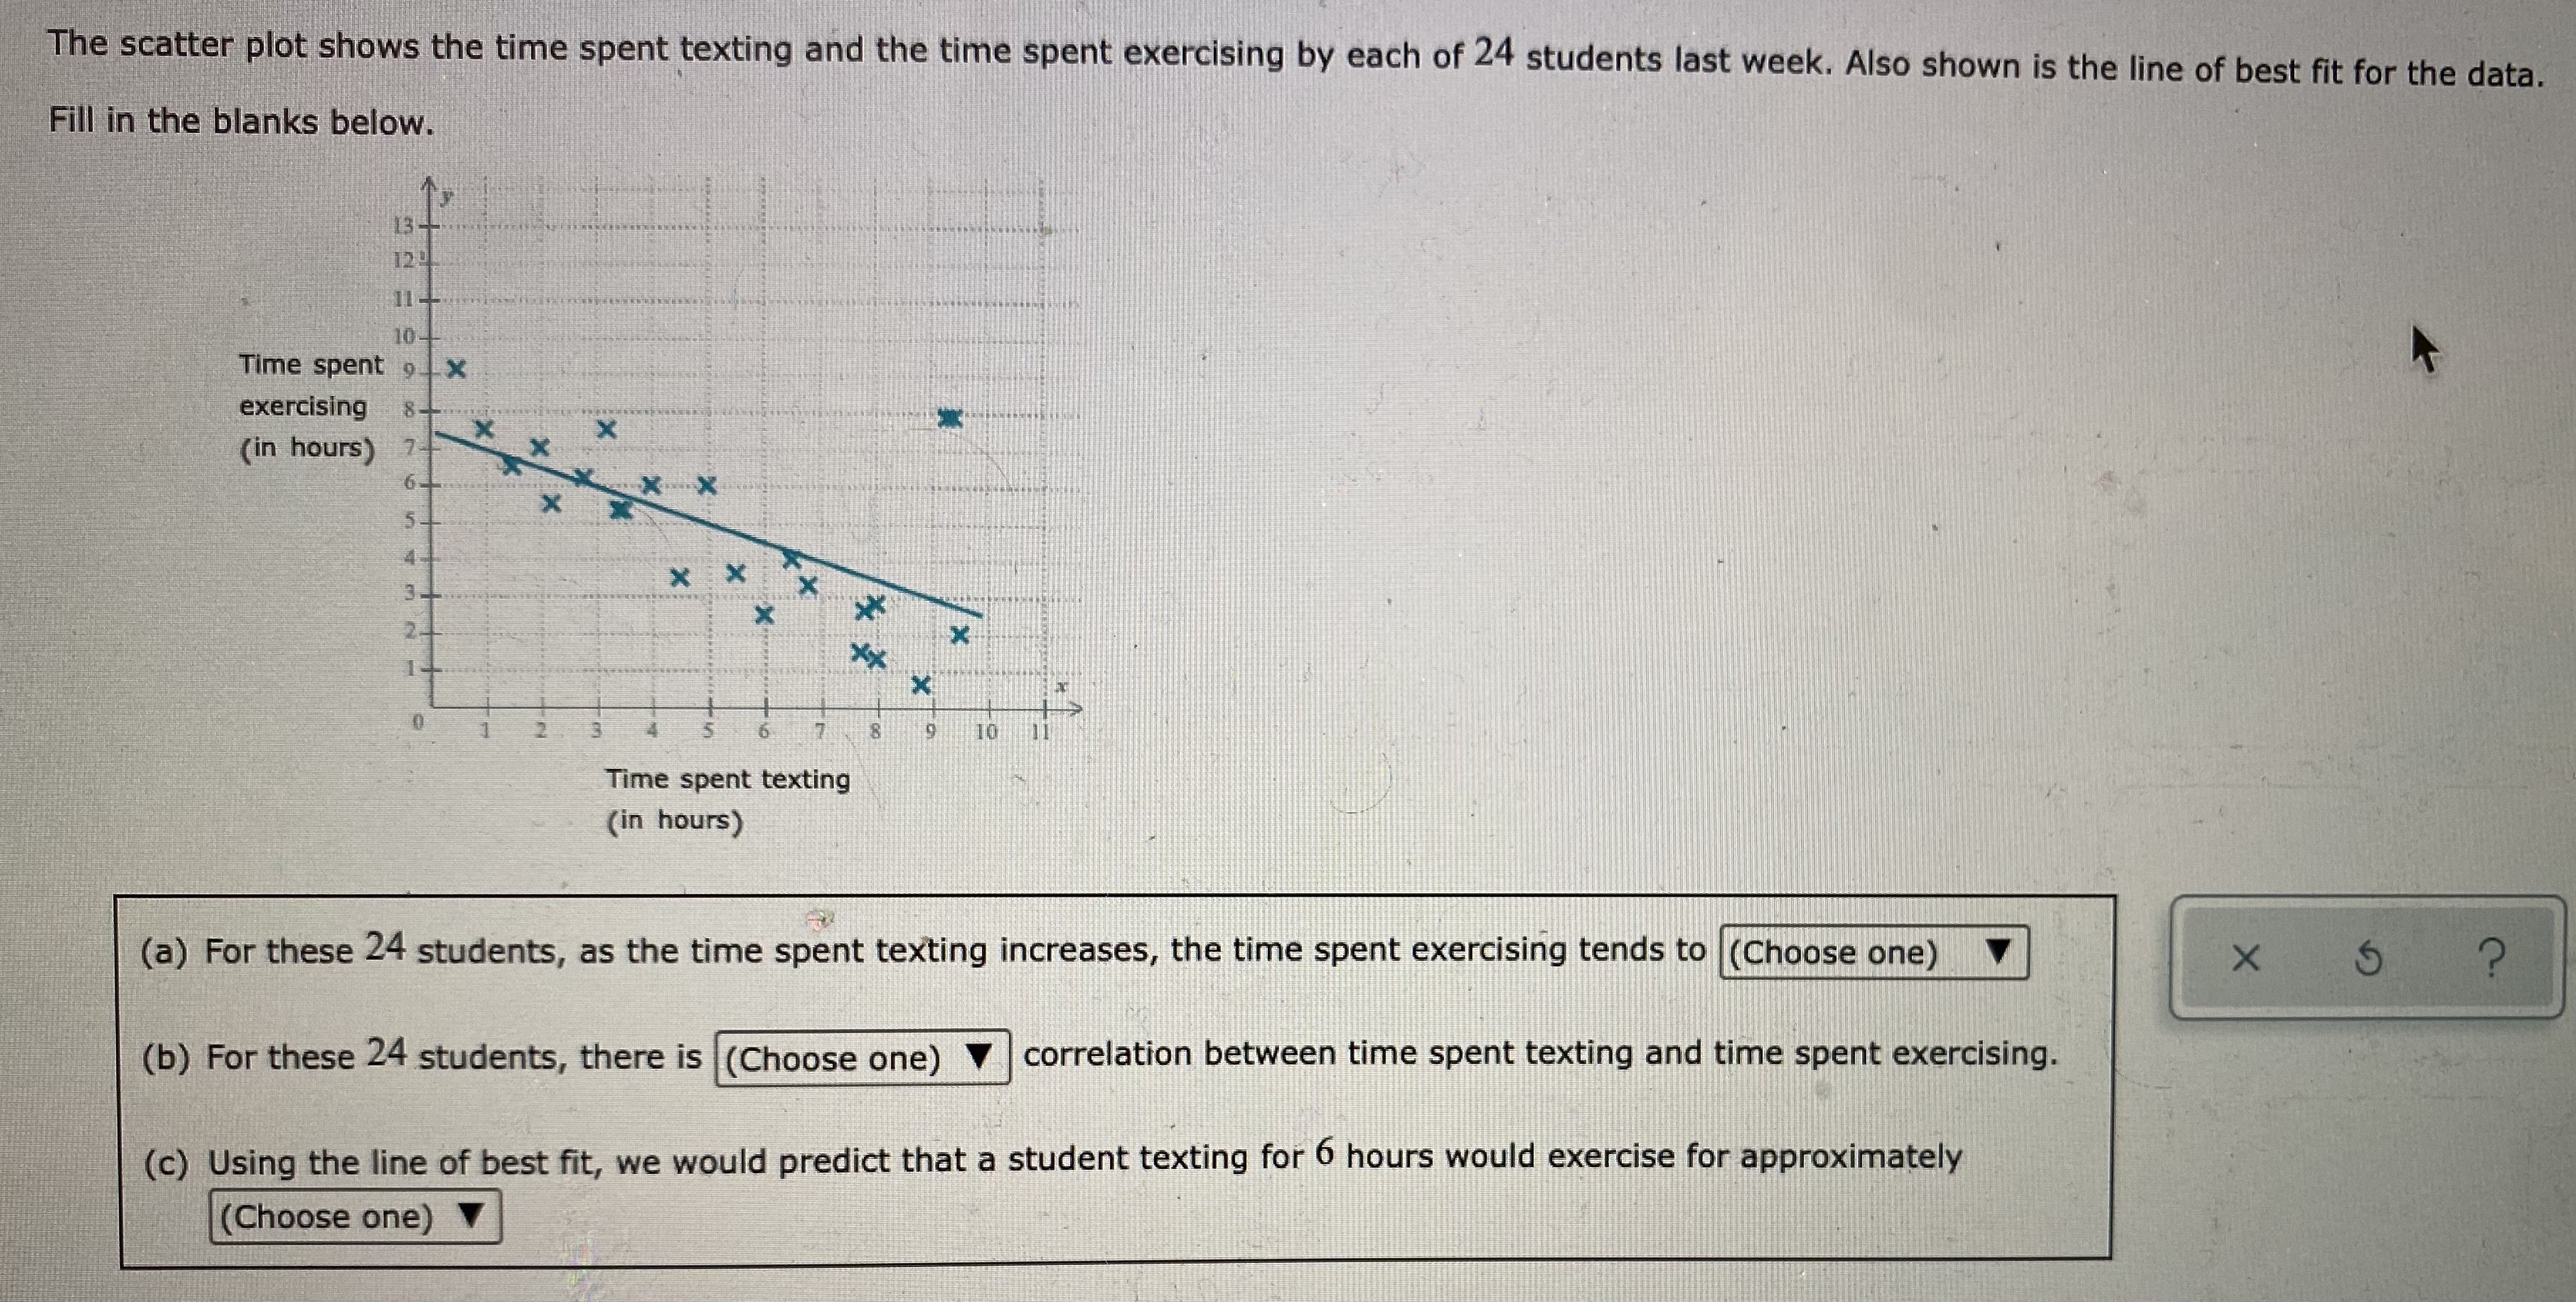
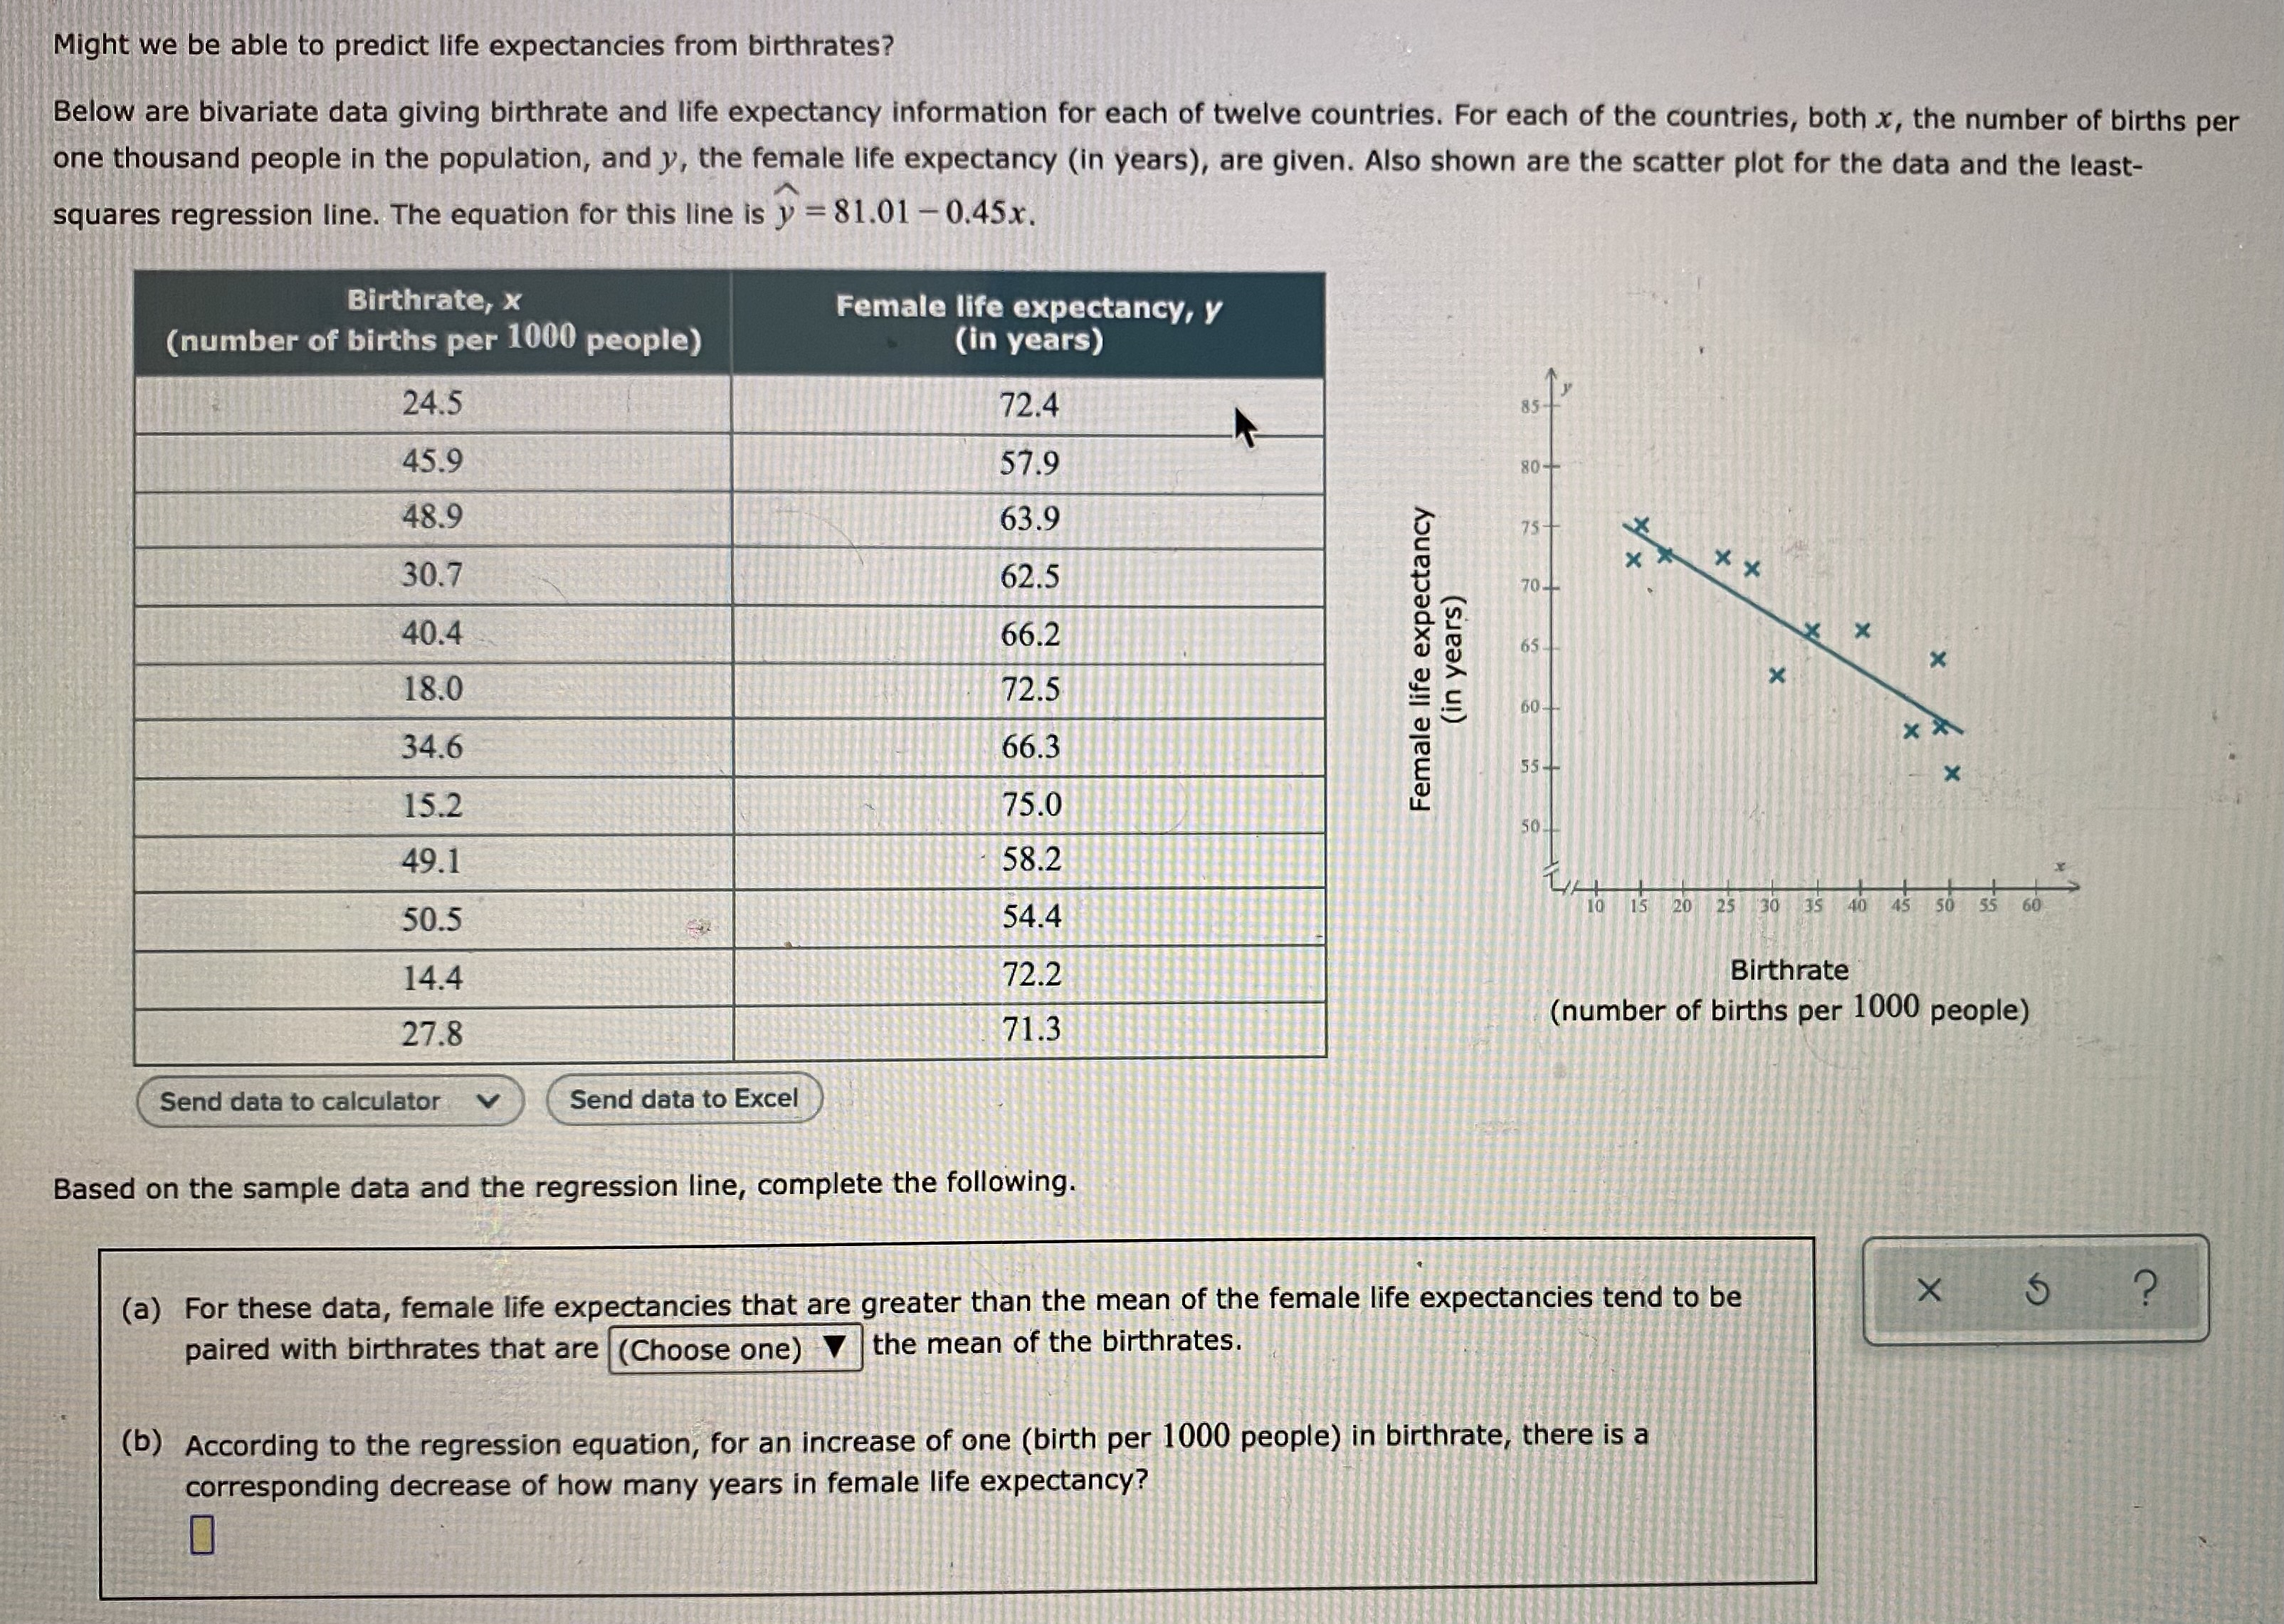
A number cube is rolled three times. An outcome is represented by a string of the sort OFE (meaning an odd number on the first roll, an even number on the second roll, and an even number on the third roll). The & outcomes are listed in the table below. Note that each outcome has the same probability. For each of the three events in the table, check the outcome(s) that are contained in the event. Then, in the last column, enter the probability of the event. Outcomes 00 Probability EEE OOE EEO EOO OEE EOE OEO X 5 ? Event A: An even number on both the O first and the last rolls Event B: Exactly one odd number Event C: Two or more odd numbersThe scatter plot shows the time spent texting and the time spent exercising by each of 24 students last week. Also shown is the line of best fit for the data. Fill in the blanks below. 13- 10- Time spent 9 X exercising 8- (in hours) X 8 9 Time spent texting (in hours) (a) For these 24 students, as the time spent texting increases, the time spent exercising tends to (Choose one) X 5 ? (b) For these 24 students, there is (Choose one) correlation between time spent texting and time spent exercising. (c) Using the line of best fit, we would predict that a student texting for 6 hours would exercise for approximately (Choose one)Might we be able to predict life expectancyes from birthrates? Below are bivariate data giving birthrate and life expectancy information for each of twelve countries. For each of the countries, both x, the number of births per one thousand people in the population, and y, the female life expectancy (in years), are given. Also shown are the scatter plot for the data and the least- squares regression line. The equation for this line is y = 81.01 - 0.45x. Birthrate, X Female life expectancy, y (number of births per 1000 people) (in years) 24.5 72.4 45.9 57.9 80+ 48.9 63.9 75- 30.7 62.5 x x 70- 40.4 66.2 (in years) Female life expectancy 18.0 72.5 X 60 34.6 66.3 x X 55- 15.2 75.0 50 49.1 58.2 50.5 54.4 10 20 40 45 50 55 60 14.4 72.2 Birthrate (number of births per 1000 people) 27.8 71.3 Send data to calculator v Send data to Excel Based on the sample data and the regression line, complete the following. (a) For these data, female life expectancyes that are greater than the mean of the female life expectancyes tend to be X ? paired with birthrates that are (Choose one) V the mean of the birthrates. (b) According to the regression equation, for an increase of one (birth per 1000 people) in birthrate, there is a corresponding decrease of how many years in female life expectancy?Answer the questions below. (a) A flute instructor examined student progress. He found that playing a longer song does not necessarily mean that a student will have more or fewer wrong notes. What can he conclude? There is no correlation between song length and number of wrong notes. There is a correlation between song length and number of wrong notes. There may or may not be causation. Further studies would have to be done to determine this. OThere is a correlation between song length and number of wrong notes. There is probably also causation. This is because there is likely an increase in the number of wrong notes with an increase in the song length. (b) An environmental study was conducted. It reported that, for a park, having more visitors indicates having a larger number of trees. What can be determined? OThere is no correlation between number of visitors and number of trees. OThere is a correlation between number of visitors and number of trees. However, there is no causation. This is because there is an increase in the number of trees with an increase in the number of visitors. OThere is a correlation between number of visitors and number of trees. There may or may not be causation. Further studies would have to be done to determine this. (c) Data was collected at a tennis court. It showed that being older implies that a player will stay for a shorter length of time. What is likely true? There is no correlation between age and length of stay. There is a correlation between age and length of stay. There may or may not be causation. Further studies would have to be done to determine this. There is a correlation between age and length of stay. However, there is no causation. This is because there is a decrease in the length of stay with an increase in age.Here is a table showing all 52 cards in a standard deck. Face cards Color Suit Ace Two Three Four Five Six Seven Eight Nine Ten Jack Queen King Red Hearts 8 10 Red Diamonds 9. 10 Black Spades 84 94 104 Black Clubs |Add 24 84 94 104 Jo Of K& Suppose one card is drawn at random from a standard deck. Answer each part. Write your answers as fractions. (a) What is the probability that the card drawn is a face card? X ? (b) What is the probability that the card drawn is a spade? (c) What is the probability that the card drawn is a face card or a spade?Government agencies keep data about the income distribution of the population. The Garcia family and Moore family live in a county with 5000 families. The Garcia family's income is at the 83rd "percentile. The Moore family's income is at the 45" percentile. (If necessary, consult a list of formulas.) (a) Which of the following must be true about the Garcia family's and the Moore family's incomes? X 5 ? Both the Garcia family and the Moore family earn more than the median income. O Both the Garcia family and the Moore family earn less than the median income. The Garcia family earns more than the Moore family. O The Moore family earns more than the Garcia family. (b) Which of the following must be true about the Garcia family's income? O About 83% of the families in their county earn less than the Garcia family. The Garcia family earns about 83% of the highest income in their county. The Garcia family's income is in the bottom half of incomes in their county. O The Garcia family earns $83,000.The scatter plot shows the time spent texting, x, and the time spent exercising, ), by each of 23 students last week. (a) Write an approximate equation of the line of best fit for the data. It doesn't have to be the exact line of best fit. (b) Using your equation from part (a), predict the time spent exercising for a student who spends 4 hours texting. Note that you can use the graphing tools to help you approximate the line. (a) Write an approximate equation of the line of best fit. X 3 . ? y = 1 Time spent exercising (in hours) X (b) Using your equation from part (a), predict the time X spent exercising for a student who spends 4 hours texting. X X X X X hours X X ? 10 Time spent texting (in hours)A class is choosing a president, a vice president, and a treasurer. There are two students running for president: Maria and Linda. There are three students running for vice president: Jim, Bob, and John. There are two students running for treasurer: Amanda and Jessica. The tree diagram below shows the possible outcomes. Use the diagram to answer the questions. President Vice President Treasurer Outcome Amanda (Maria, Jim, Amanda) Jim Jessica ( Maria, Jim, Jessica) Amanda (Maria, Bob, Amanda) Maria Bob Jessica (Maria, Bob, Jessica) Amanda ( Maria, John, Amanda) John Jessica (Maria, John, Jessica) Amanda (Linda, Jim, Amanda) Jim Jessica (Linda, Jim, Jessica) Amanda (Linda, Bob, Amanda) Linda Bob Jessica Linda, Bob, Jessica) Amanda (Linda, John, Amanda) John Jessica (Linda, John, Jessica) (a) How many outcomes are there? I outcome(s) (b) How many outcomes have Jim or John being chosen? outcome(s) (c) How many outcomes have both Linda and Amanda being chosen? outcome(s)Serial numbers for a product are to be made using 4 letters followed by 4 digits. The letters are to be taken from the first 9 letters of the alphabet, with no repeats. The digits are taken from the 10 digits (0, 1, 2, ..., 9), with no repeats. How many serial numbers can be generated? (If necessary, consult a list of formulas.) X
Step by Step Solution
There are 3 Steps involved in it
Step: 1
Get Instant Access to Expert-Tailored Solutions
See step-by-step solutions with expert insights and AI powered tools for academic success
Step: 2
Step: 3
Ace Your Homework with AI
Get the answers you need in no time with our AI-driven, step-by-step assistance