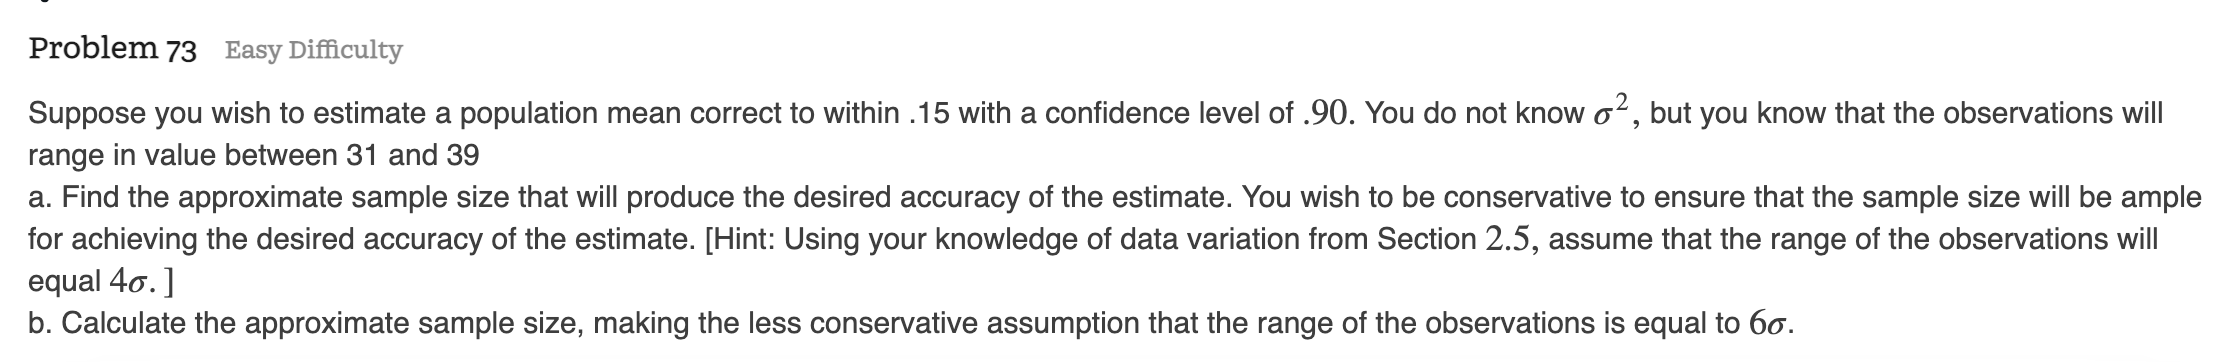
Can you help me with problem 73? Any help would be appreciated
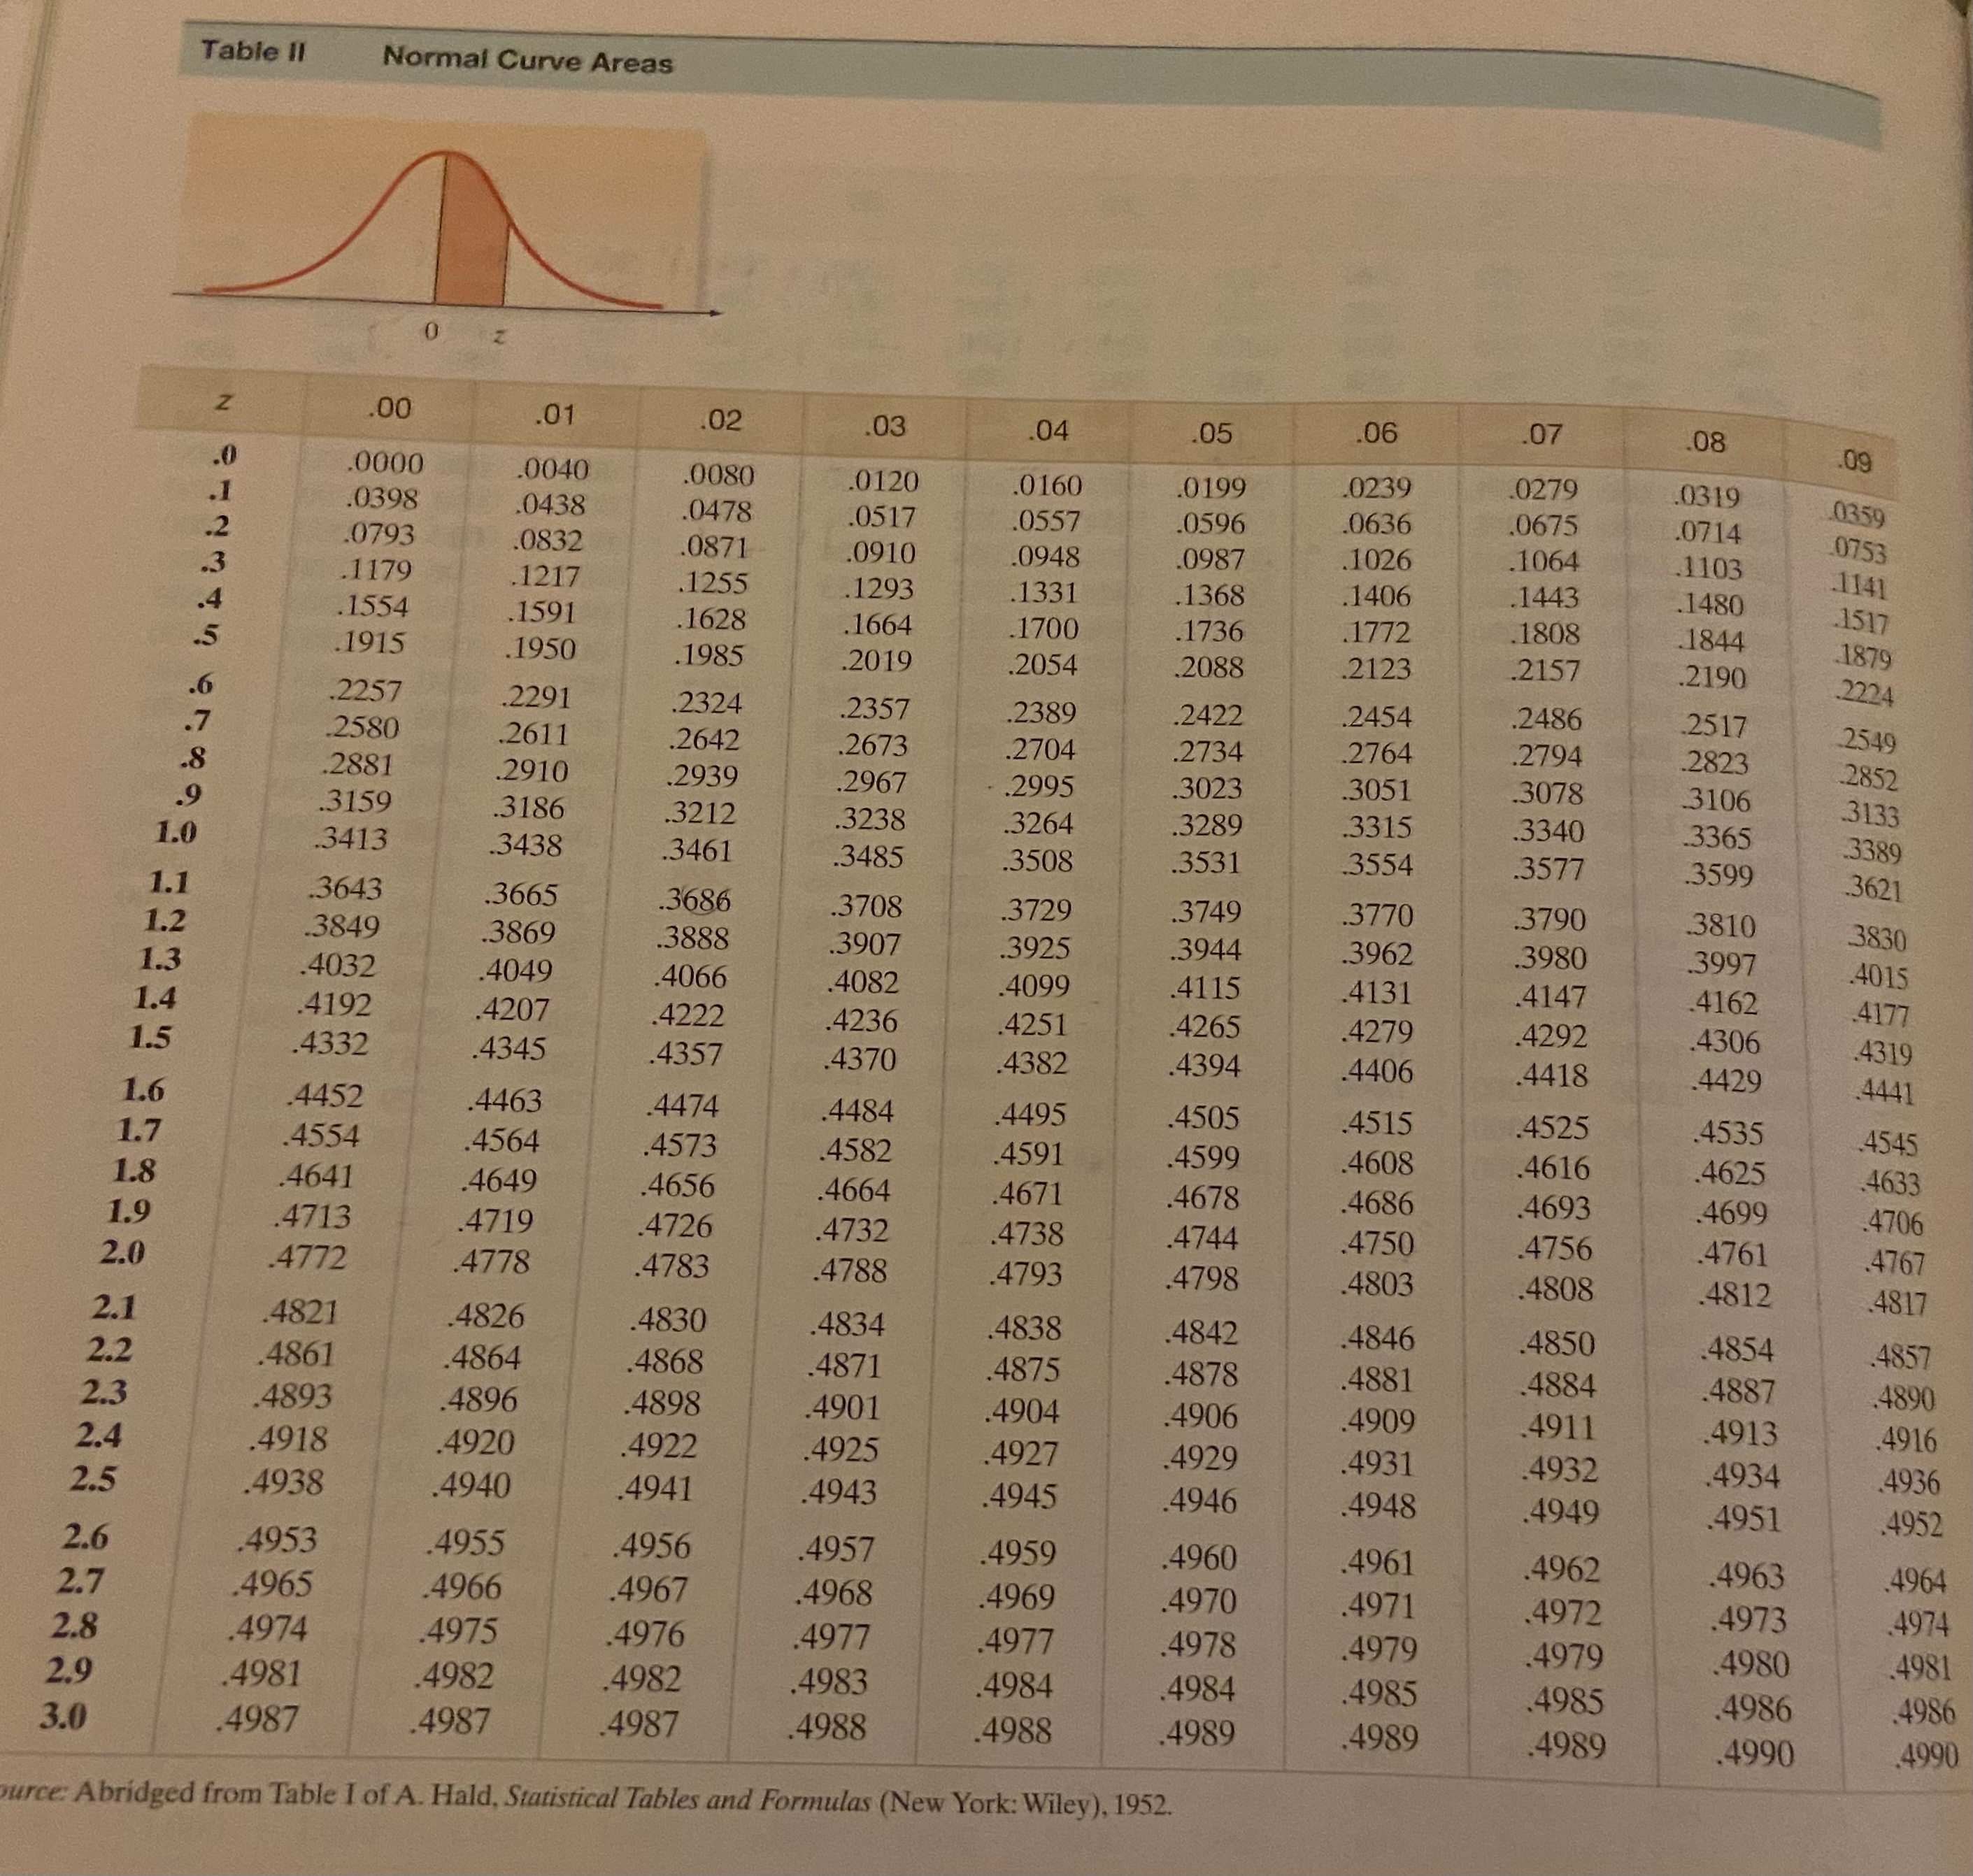
Table II Normal Curve Areas 0 Z Z 00 .01 02 03 .04 05 .06 07 08 .0000 .0040 .0080 .09 .0398 0120 .0438 0160 0199 .0239 .0279 .0478 .0319 0793 0517 .0557 0832 .0596 0636 .0675 0359 0871 .0714 .1179 .0910 .0948 .0987 1026 1064 .1103 0753 1217 .1554 1255 1293 .1331 .1141 1591 .1368 .1406 .1443 1628 .1480 1915 .1664 .1700 1950 1736 1517 .1985 .1772 1808 .1844 2019 .2054 2088 2123 2157 1879 .2257 2291 .2190 2324 2224 .2580 2357 238 .2422 .2611 2454 2486 .2642 .2517 2673 2704 .2734 2764 .2794 2549 .2881 .2910 2939 .2823 .3159 2967 .2995 3186 3023 305 .3078 2852 3106 1.0 .3212 .3413 3238 3264 3289 .3315 3133 3438 .3461 3340 3485 3365 1.1 3508 .3531 3554 .3577 3389 .3643 .3599 3665 1.2 3686 3621 .3849 3708 3869 3729 3749 .3770 .3790 3907 3810 3830 1.3 .388 .4032 .3925 .3944 .4049 .3962 .3980 4066 1082 .399 1.4 .4192 4099 .4115 4207 4131 1.5 4222 4147 4015 4162 4236 4345 4279 4292 4177 4332 4251 4265 4357 4370 .4306 4382 .4394 4406 4319 1.6 4452 .4418 4429 .4463 4474 4441 1.7 .4484 4495 4554 .4505 4564 .4515 .4573 4525 4535 1.8 .4582 4591 .4599 4545 4641 4649 4608 1.9 4656 .4616 .4664 4625 4671 4713 4678 4633 .4719 4686 4726 4693 4732 4699 4738 4706 2.0 4772 .4744 4778 4750 4783 .4788 4756 4761 4793 .4798 4767 4803 2.1 .4808 .4821 4812 4826 4830 .4817 4834 2.2 4838 4842 .4861 4864 .4846 4868 4850 4871 4875 4854 4857 2.3 .4893 .4878 4896 4881 .4898 4901 4884 4887 2.4 4904 .4906 4890 4918 4909 4920 4922 4911 4925 4913 4927 4929 .4916 2.5 .4938 4931 .4940 4941 4932 4943 4934 4945 4946 4936 .4948 .4949 2.6 4951 .4953 4955 4952 4956 4957 4959 2.7 .4960 .4961 .4965 4966 .4962 4967 4968 .4963 4969 4970 .4964 2.8 .4971 .4974 4975 .4972 4976 4977 .4973 4977 .4978 4974 2.9 .4979 .4981 4982 4982 .4979 .4983 .4980 4984 4981 4984 4985 3.0 .4985 .4987 4987 4987 4988 4986 4988 4989 4986 .4989 .4989 4990 4990 urce: Abridged from Table I of A. Hald, Statistical Tables and Formulas (New York: Wiley), 1952.Problem 73 Easy Difculty Suppose you wish to estimate a population mean correct to within .15 with a confidence level of .90. You do not know 02, but you know that the observations will range in value between 31 and 39 a. Find the approximate sample size that will produce the desired accuracy of the estimate. You wish to be conservative to ensure that the sample size will be ample for achieving the desired accuracy of the estimate. [Hint: Using your knowledge of data variation from Section 2.5, assume that the range of the observations will equal 40'. ] b. Calculate the approximate sample size, making the less conservative assumption that the range of the observations is equal to 60