Answered step by step
Verified Expert Solution
Link Copied!

Question

1 Approved Answer

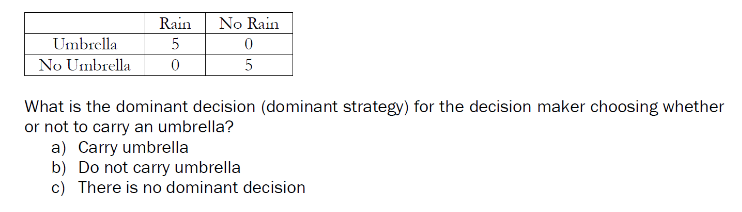
Can you help me with these questions? 18. Rain No Rain Umbrella 5 No Umbrella 0 5 What is the dominant decision (dominant strategy) for

image text in transcribedimage text in transcribedimage text in transcribedimage text in transcribedimage text in transcribedimage text in transcribedimage text in transcribedimage text in transcribedimage text in transcribedimage text in transcribedimage text in transcribedimage text in transcribed

Can you help me with these questions?

18.

image text in transcribedimage text in transcribedimage text in transcribedimage text in transcribedimage text in transcribedimage text in transcribedimage text in transcribedimage text in transcribedimage text in transcribedimage text in transcribedimage text in transcribedimage text in transcribed
Rain No Rain Umbrella 5 No Umbrella 0 5 What is the dominant decision (dominant strategy) for the decision maker choosing whether or not to carry an umbrella? a) Carry umbrella b) Do not carry umbrella c) There is no dominant decisionCompany 2 Company 1 Low Prices High Prices Low Prices C1: 2000 C1: 13000 C2: 2000 C2:0 High Prices C1:0 C1: 10000 C2: 13000 C2: 10000 True or False. In the above bimatrix both company 1 and company 2 have dominant decisions (dominant strategies) of setting high prices.Per acre budgets Allocated Corn Soybean Wheat Input & Costs Planting (hrs) 0.45 0.45 0.3 Planting (Var cost) $ 60.00 $ 45.06 $ 30.00 Harvest (hrs) 1.45 Harvest (Var cost) $100.00 $ 50.06 $ 40.00 Labor total 1.9 1.45 1.3 Labor price $ 6.00 $ 6.00 $ 6.00 Var Cost (non-Labor) $160.00 $ 95.00 $ 70.00 Var Cost (per-acre) $171.40 $103.70 $ 77.80 Unallocated (land prep) Plowing (hrs) 0.60 9.60 0.60 Plowing (Var cost) $ 10.00 $ 10.06 $ 10.09 Disking (hrs) 0.50 0.50 0.50 Disking (Var cost) $ 10.00 $ 10.00 $ 10.00 Total Var Cost (non-Labor) $180.00 $115.00 $ 90.00 Total Var Cost (per-acre) $198.00 $130.30 $104.40 Labor Total (all hours) 3.00 2.55 2.40 Output & Revenues Yield 135 45 65 Expected price $ 2.60 $ 6.35 $ 3.70 Revenue $351.00 $285.75 $240.50 Allocated Gross Margin (pre-labor) $191.00 $190.75 $170.50 Gross Margin (w/labor) $179.60 $182.05 $162.70 Unallocated + Allocated Gross Margin (pre-labor $171.00 $170.75 $150.50 Gross Margin (w/labor) $153.00 $155.45 $136.10 "Assumptions Family Labor (1760 hours) is assumed paid at the hired Labor rate In the budget graphic above, changes to which of the following will not change the expected revenue? a) Yield b) Expected price c) Variable cost charge for disking d) All of the aboveRain No Rain Umbrella 5 5 No Umbrella -2 3 True or False. If the decision maker in the above matrix is a Maxi-min decision maker they should choose to carry an umbrella. a) True b) False6.50% 6.00% 5.50% Portfolio Variance 5.00% 4.50% 4.00% 3.00% 3.50% 4.00% 4.50% 5.00% 5.50% Portfolio expected return The graph above shows a mean-variance frontier. What do we know about point below above the mean-variance frontier? a) A decision maker operating at these points are more efficient than the average. b) A decision maker operating at these points take on too much risk for the return they are earning c) The points above the frontier are infeasibleLabor Shadow Prices - 6 8 8 6 8 8 8 8 Model price per hour for labor 0 500 1000 1500 2000 Hours available of family labor -Fam Lab SP Hir Lab SP In the graphic above showing shadow prices, what is represented by the gap between family labor and hired labor. a) The constraint limiting family labor b) Regulations in the labor market c) The preference for using machinery over labor d) None of the aboveRain No Rain Umbrella 5 0 No Umbrella 0 5 True or False. If the decision maker in the above matrix is an expected value decision maker they should choose to carry an umbrella only if the forecast for rain is larger than 50%. a) True b) FalseTrue or False. The RHS of a "balance constraint" in a linear program should be 0 (zero). a) True b ) FalsePer acre budgets Allocated Corn Soybean Wheat Input & Costs Planting (hrs) 0.45 0.45 0.3 Planting (Var cost) $ 60.00 $ 45.06 $ 30.00 Harvest (hrs) 1.45 Harvest (Var cost) $100.60 $ 50.00 $ 40.00 Labor total 1.9 1.45 1.3 Labor price $ 6.00 $ 6.00 $ 6.00 Var Cost (non-Labor) $160.00 $ 95.00 $ 70.00 Var Cost (per-acre) $171.40 $103.70 $ 77.80 Unallocated (land prep) Plowing (hrs) 0.60 0.60 0.60 Plowing (Var cost) $ 10.00 $ 10.00 $ 10.00 Disking (hrs) 0.50 0.50 0.50 Disking (Var cost) $ 10.00 $ 10.00 $ 10.00 Total Var Cost (non-Labor) $180.00 $115.60 $ 90.00 Total Var Cost (per-acre) $198.00 $130.30 $104.40 Labor Total (all hours) 3.00 2.55 2.40 Output & Revenues Yield 135 45 65 Expected price $ 2.60 $ 6.35 $ 3.70 Revenue $351.00 $285. 75 $240.50 Allocated Gross Margin (pre-labor) $191.00 $190.75 $170.50 Gross Margin (w/labor) $179.60 $182.05 $162.70 Unallocated + Allocated Gross Margin (pre-labor) $171.60 $170.75 $150.50 Gross Margin (w/labor) $153.00 $155.45 $136. 10 "Assumptions Family Labor (1780 hours) is assumed paid at the hired Labor rate True or False. In the budget graphic above, an increase in the price of labor will increase the expected gross margin. a) True b) FalseTable 2. Constraint sensitivity report for a cost minimization transportation problem with 3 source cities and 5 destination cities. 25 Constraints 26 Final Shadow Constraint Allowable Allowable 27 Cell Name Value Price R.H. Side Increase Decrease 28 $B$12 LHS New York 100 300 100 0 50 29 $C$12 LHS Boston 50 340 50 0 50 30 SD$12 LHS Chicago 50 220 50 0 50 31 SE$12 LHS Los Angeles 50 380 50 0 32 SF$12 LHS Dallas 50 400 50 O 33 $G$9 Cincinnati LHS 100 -60 100 50 OOOOO 34 $G$10 Denver LHS 100 -180 100 0 35 $G$11 Atlanta LHS 100 0 100 1E+30 26Table 3. Variable cells sensitivity report for a cost minimization transportation problem with 3 source cities and 5 destination cities. Variable Cells Final Reduced Objective Allowable Allowable Cell Name Value Cost Coefficient Increase Decrease $B$9 Cincinnati New York 50 0 240 20 80 $C$9 Cincinnati Boston 0 20 300 1E+30 20 $D$9 Cincinnati Chicago 50 0 160 80 220 SE$9 Cincinnati Los Angeles 180 500 1E+30 180 SF$9 Cincinnati Dallas 0 20 360 1E+30 20 $B$10 Denver New York 0 300 420 16+30 300 SC$10 Denver Boston 0 280 440 1E+30 280 $D$10 Denver Chicago 0 260 300 1E+30 260 SE$10 Denver Los Angeles 50 0 200 100 380 $F$10 Denver Dallas 50 0 220 180 100 $B$11 Atlanta New York 50 0 300 80 20 SC$11 Atlanta Boston 50 340 20 340 $D$11 Atlanta Chicago 0 80 300 1E+30 80 SE$11 Atlanta Los Angeles 0 100 480 1E+30 100 SF$11 Atlanta Dallas 0 0 400 20 180Figure. Spreadsheet model of beverage choice (PF, SS) that maximize profits shown in the objective cell. PF SS Choice Var 25 25 Obj Coef 8 6 350

Step by Step Solution

There are 3 Steps involved in it

Step: 1

blur-text-image

Get Instant Access to Expert-Tailored Solutions

See step-by-step solutions with expert insights and AI powered tools for academic success

Step: 2

blur-text-image

Step: 3

blur-text-image

Ace Your Homework with AI

Get the answers you need in no time with our AI-driven, step-by-step assistance

Get Started

Recommended Textbook for

International Economics

Authors: Robert C. Feenstra, Alan M. Taylor

3rd edition

978-1429278515, 142927851X, 978-1319029517, 1319029515, 978-1429278447

More Books

Students also viewed these Economics questions

Question

The role of life: It consists of your own service to yourself.

Answered: 1 week ago