

Question: Can you help me with these questions? The data is on a separate screenshot. Hub Daemen Do Homework - Section 2.2 Homework - Google Chrome


Can you help me with these questions? The data is on a separate screenshot.
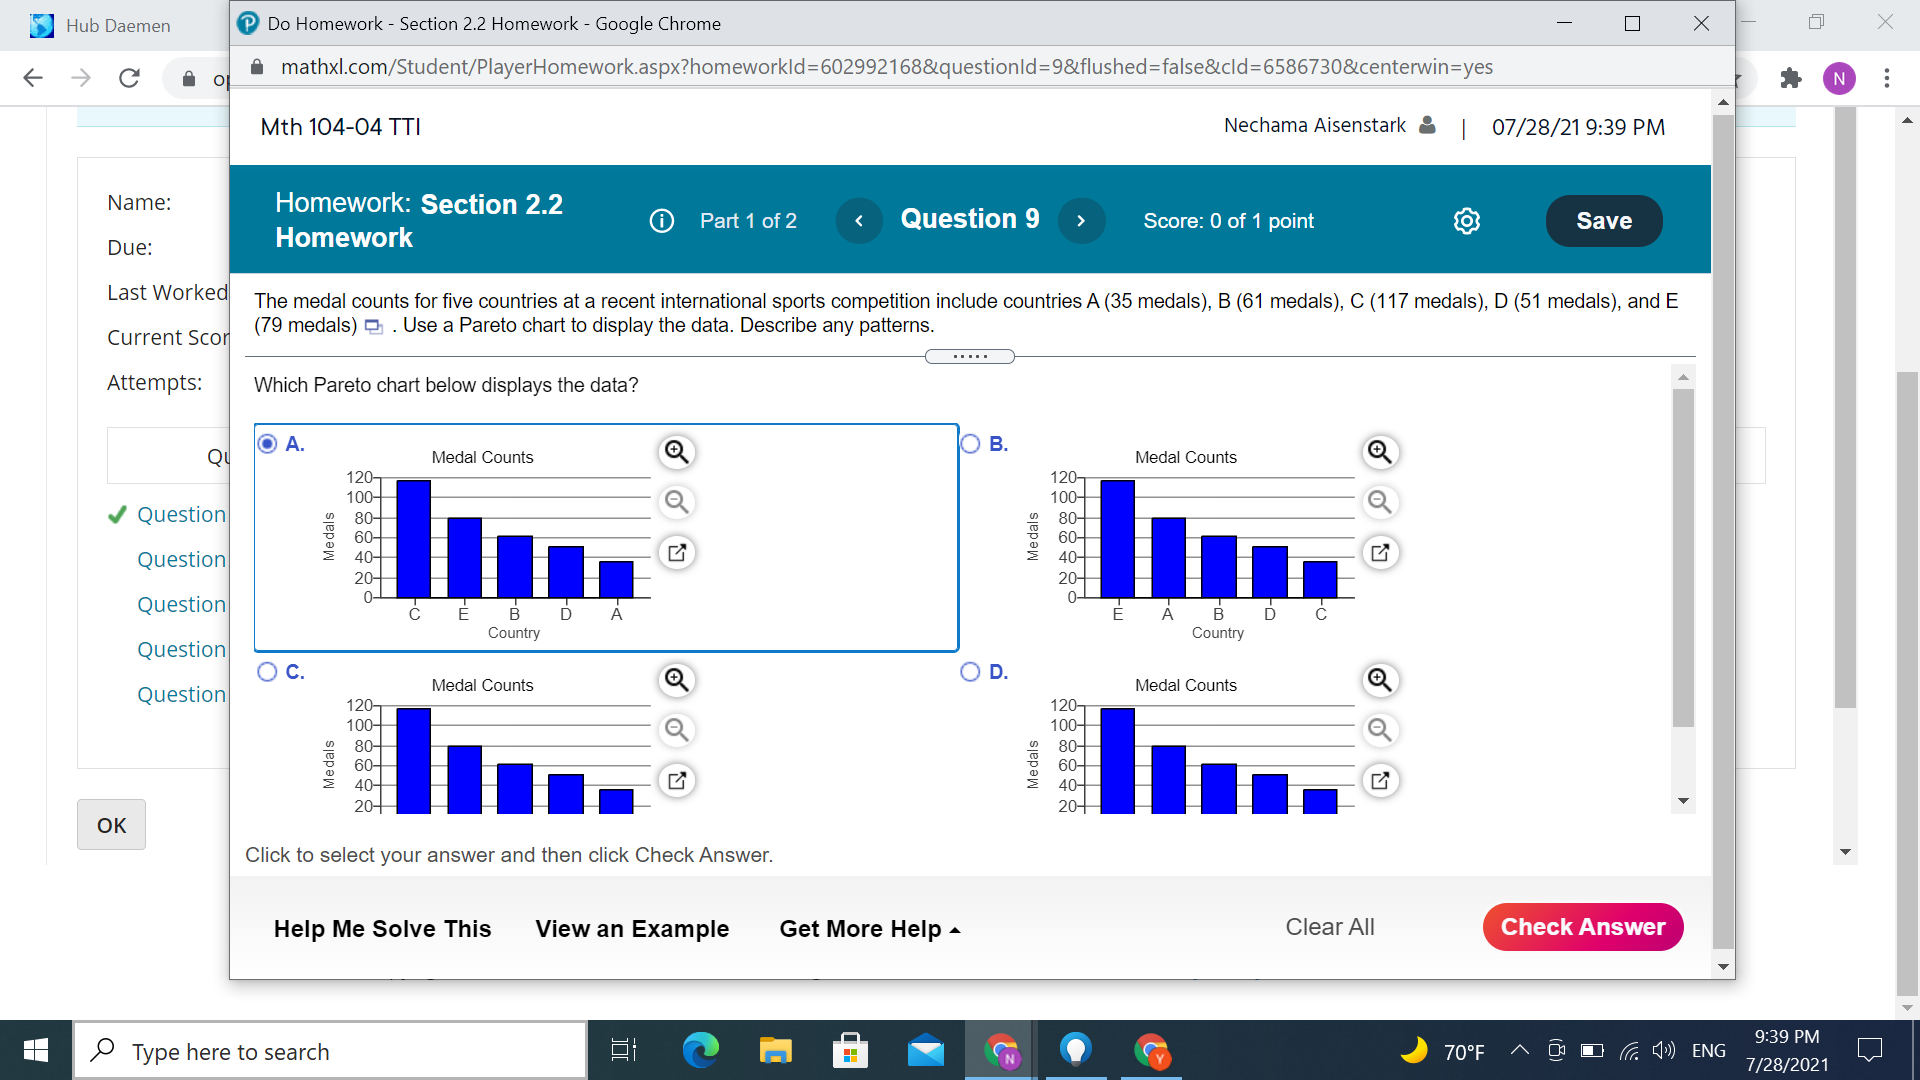
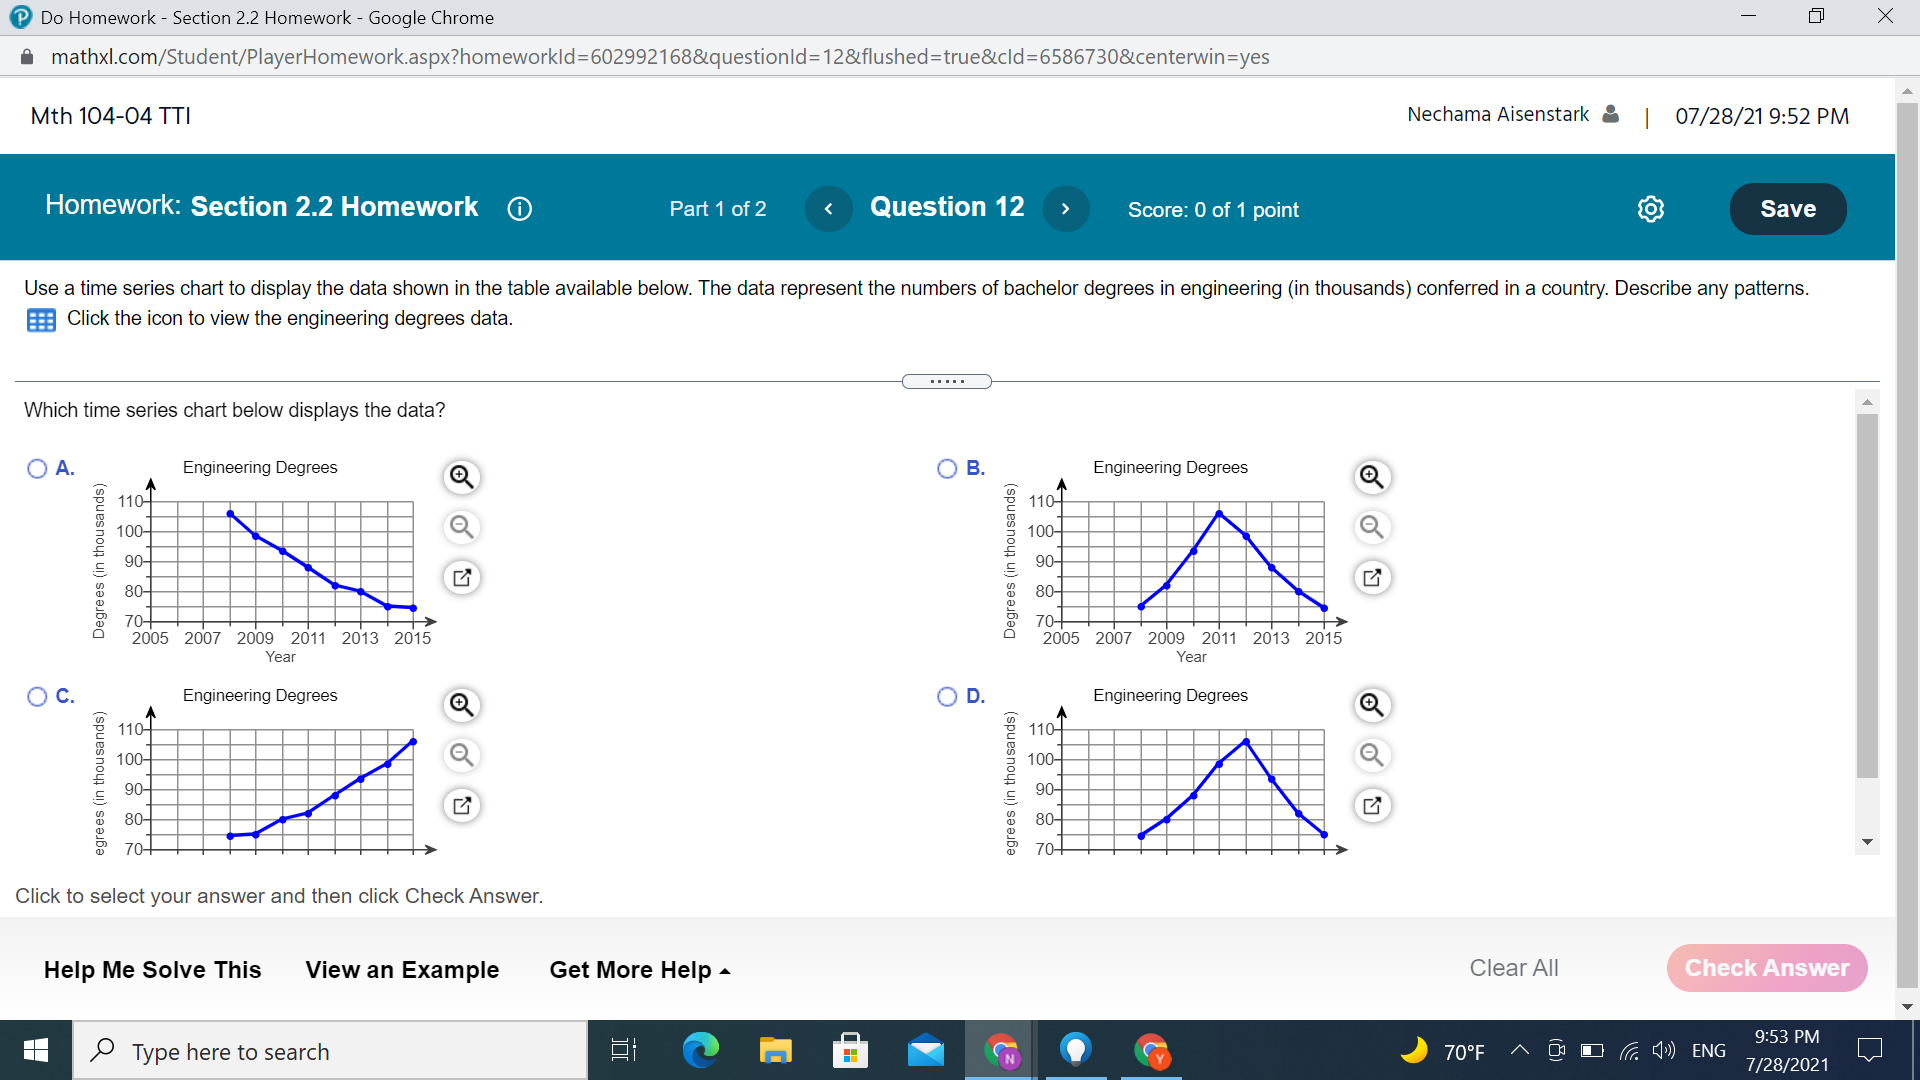
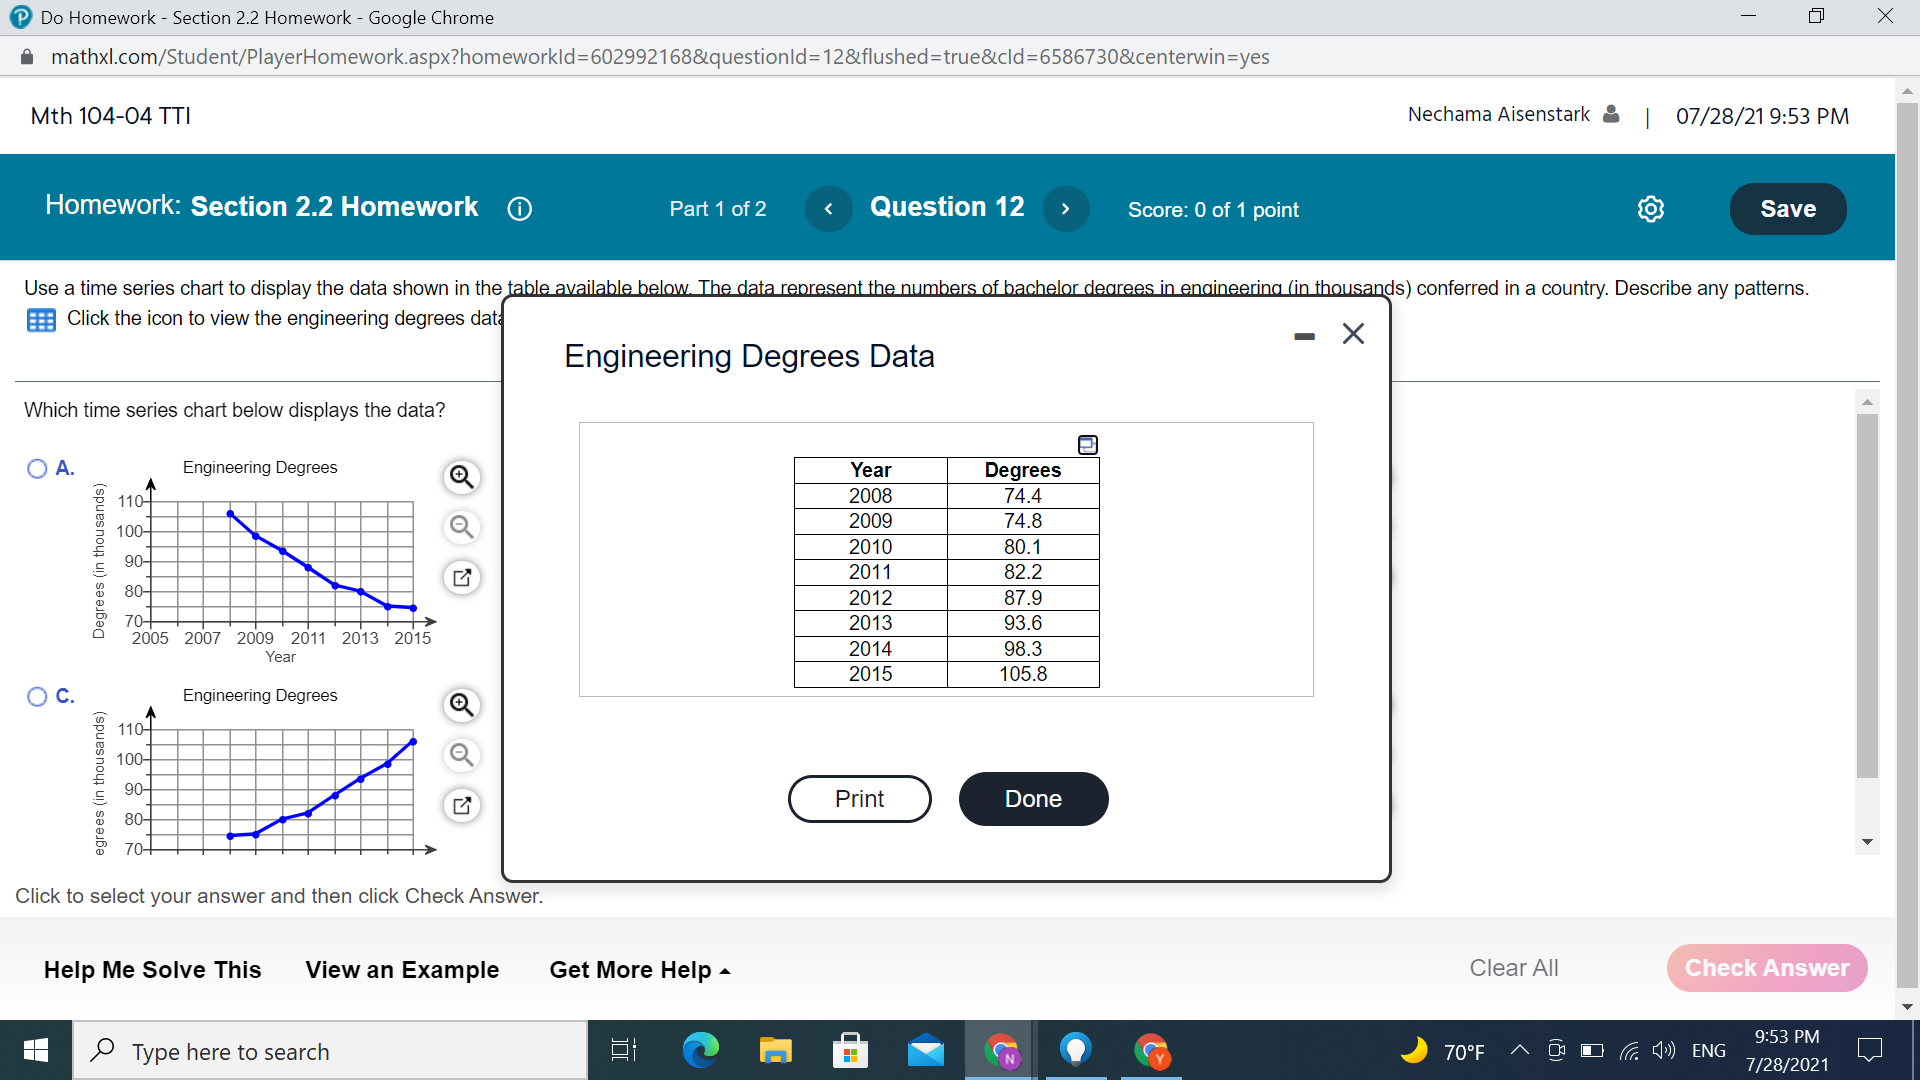

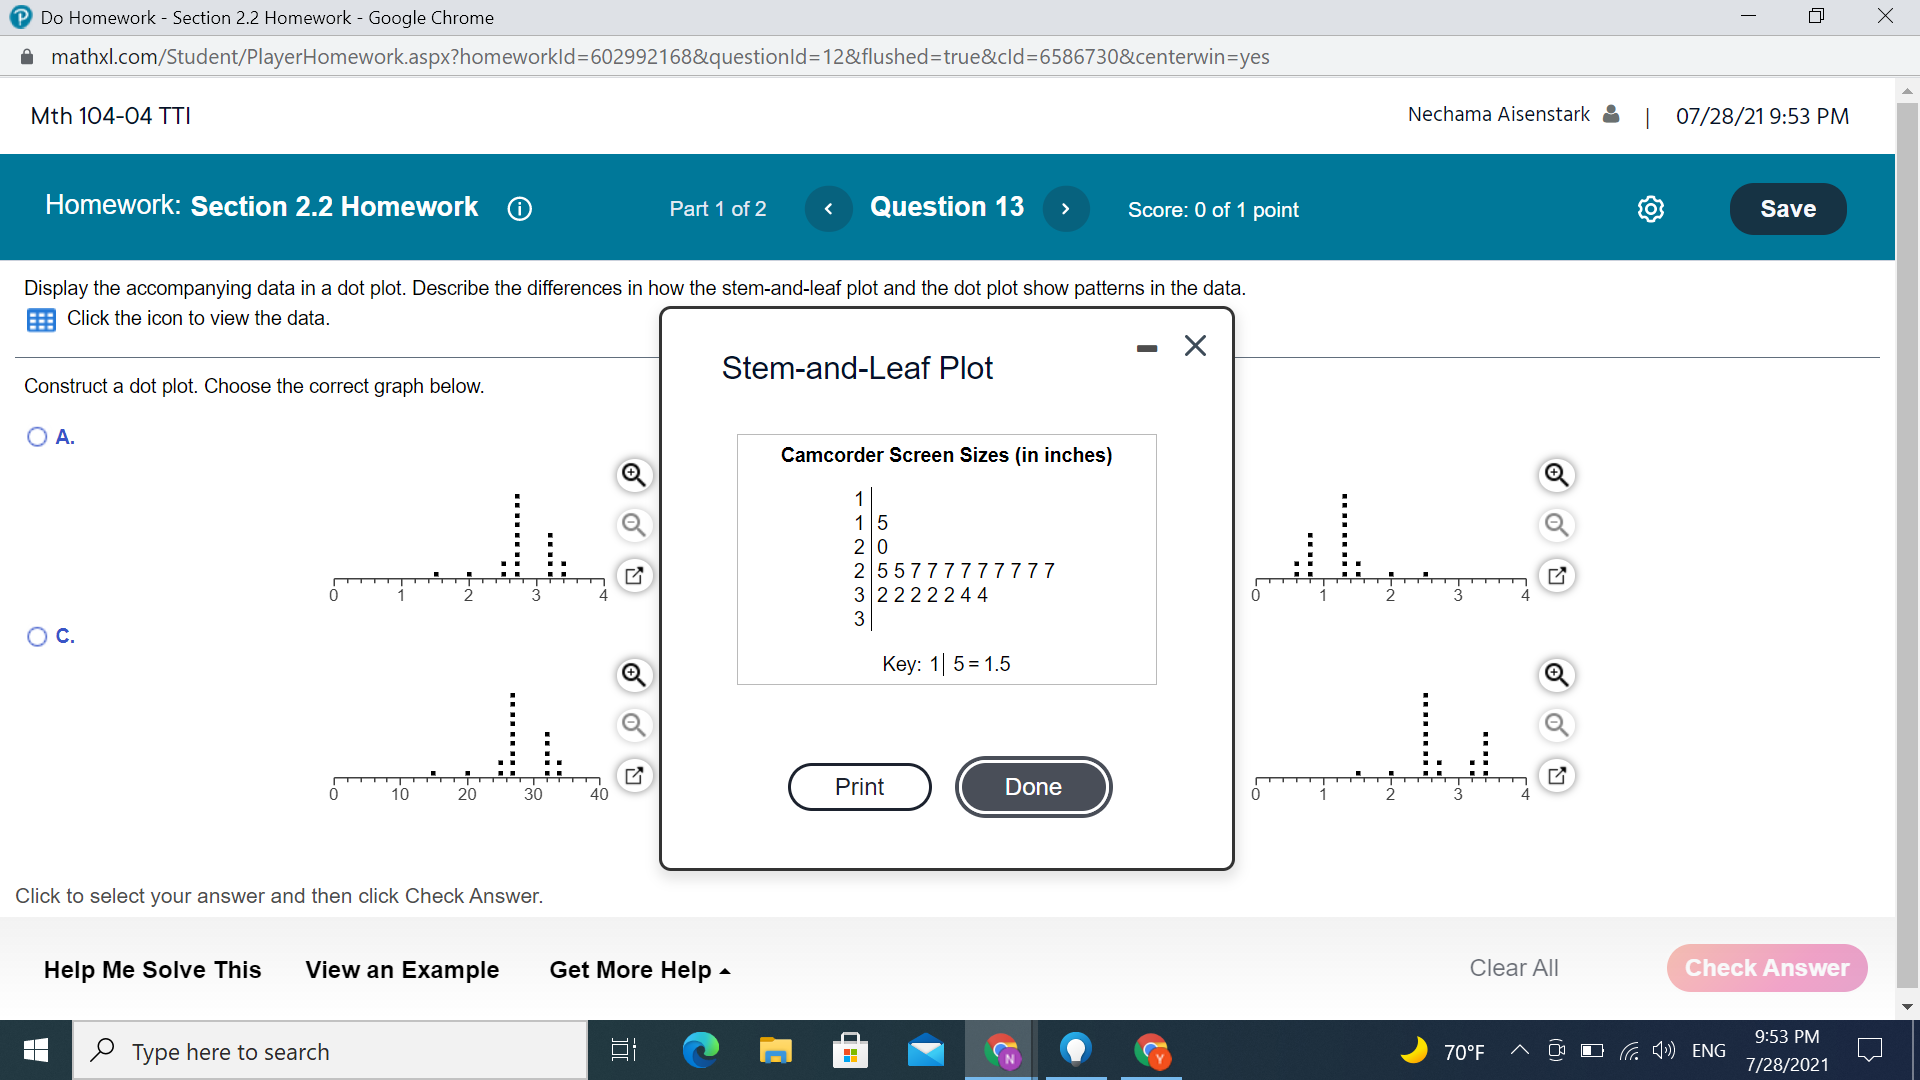

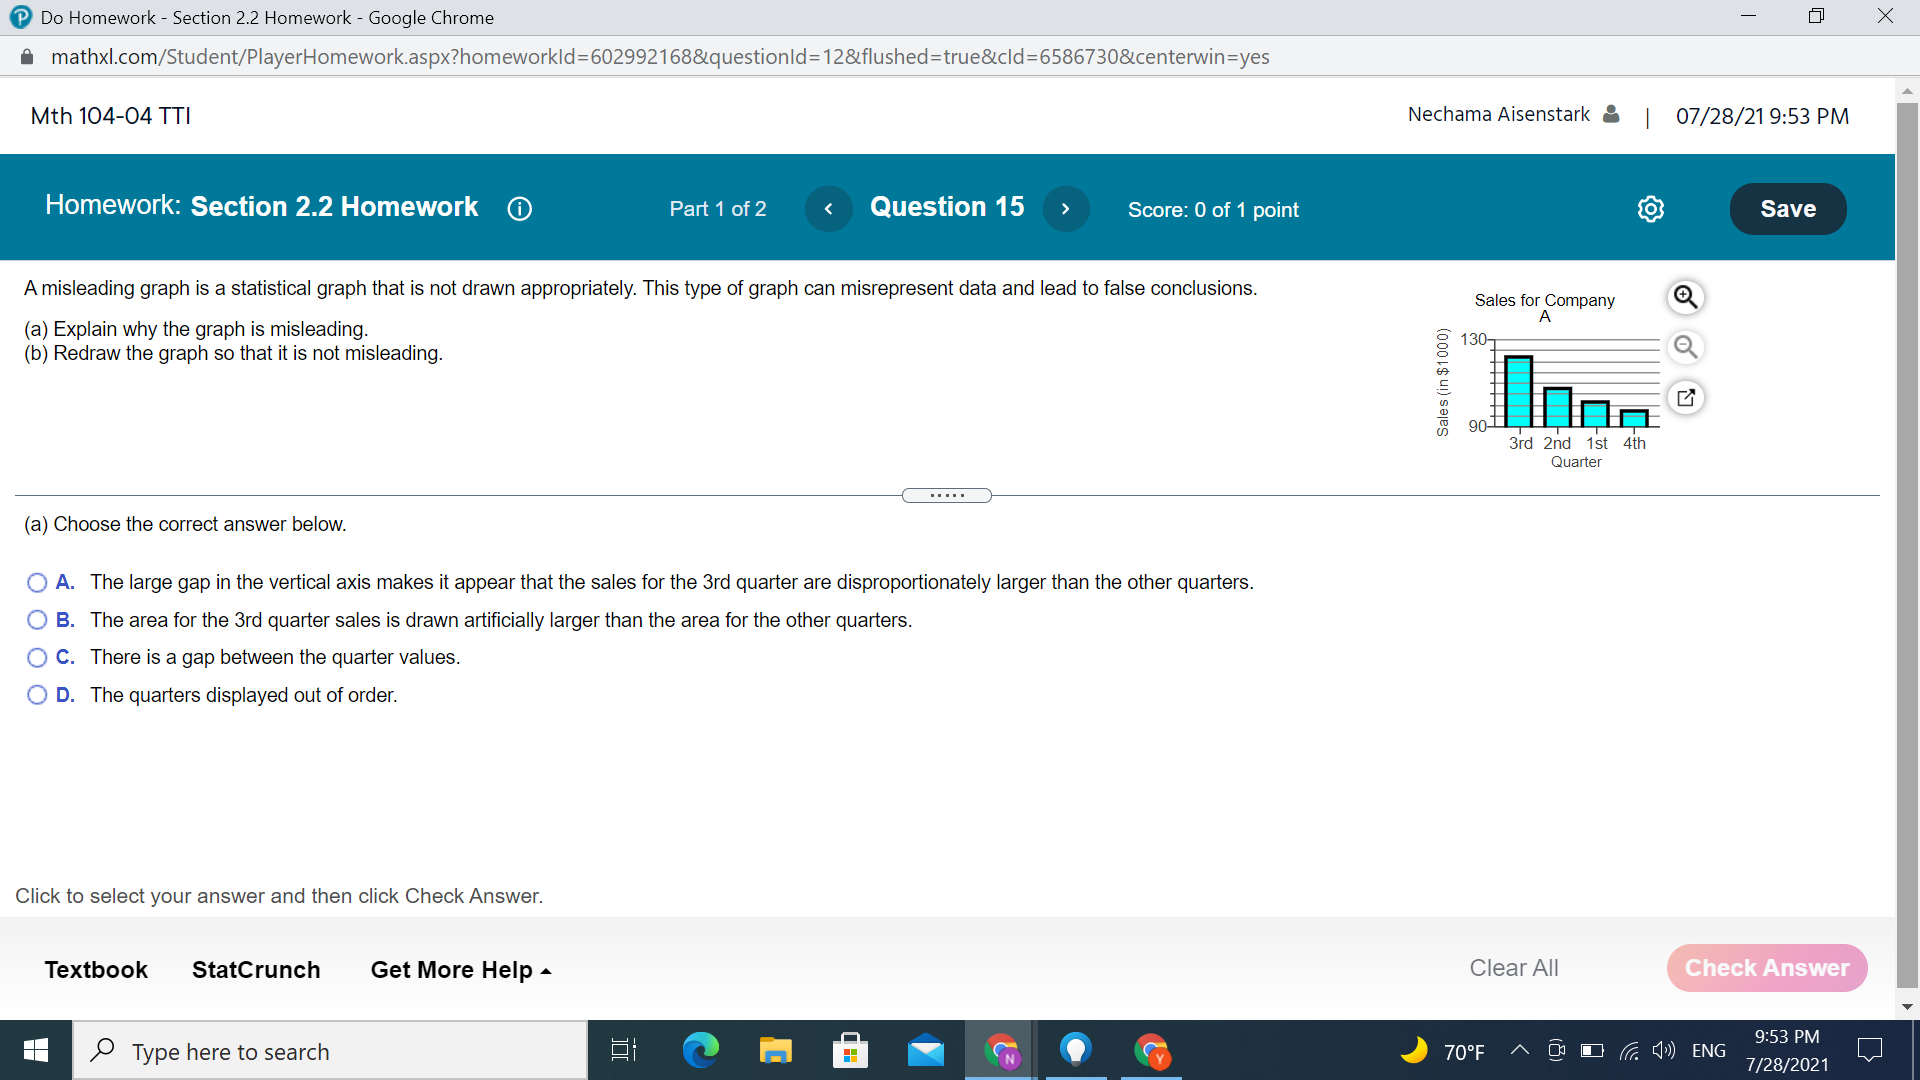


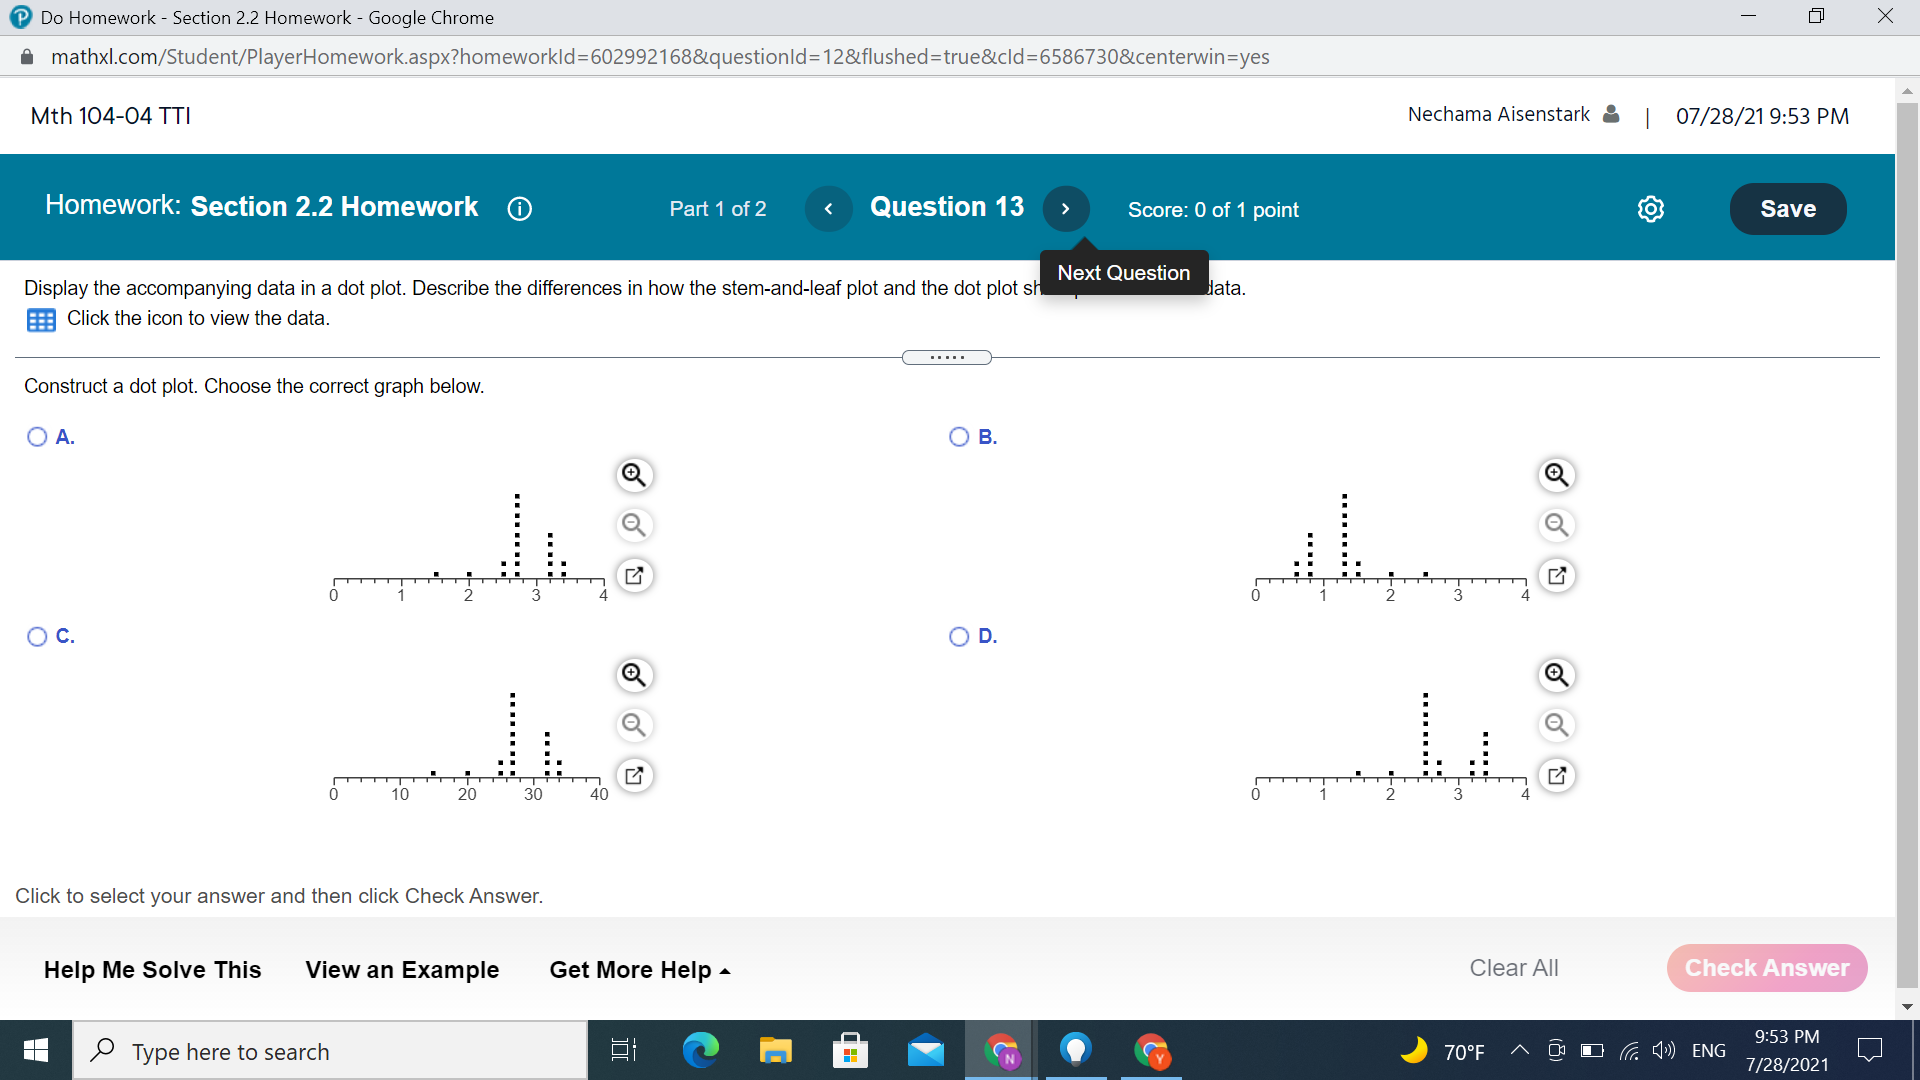
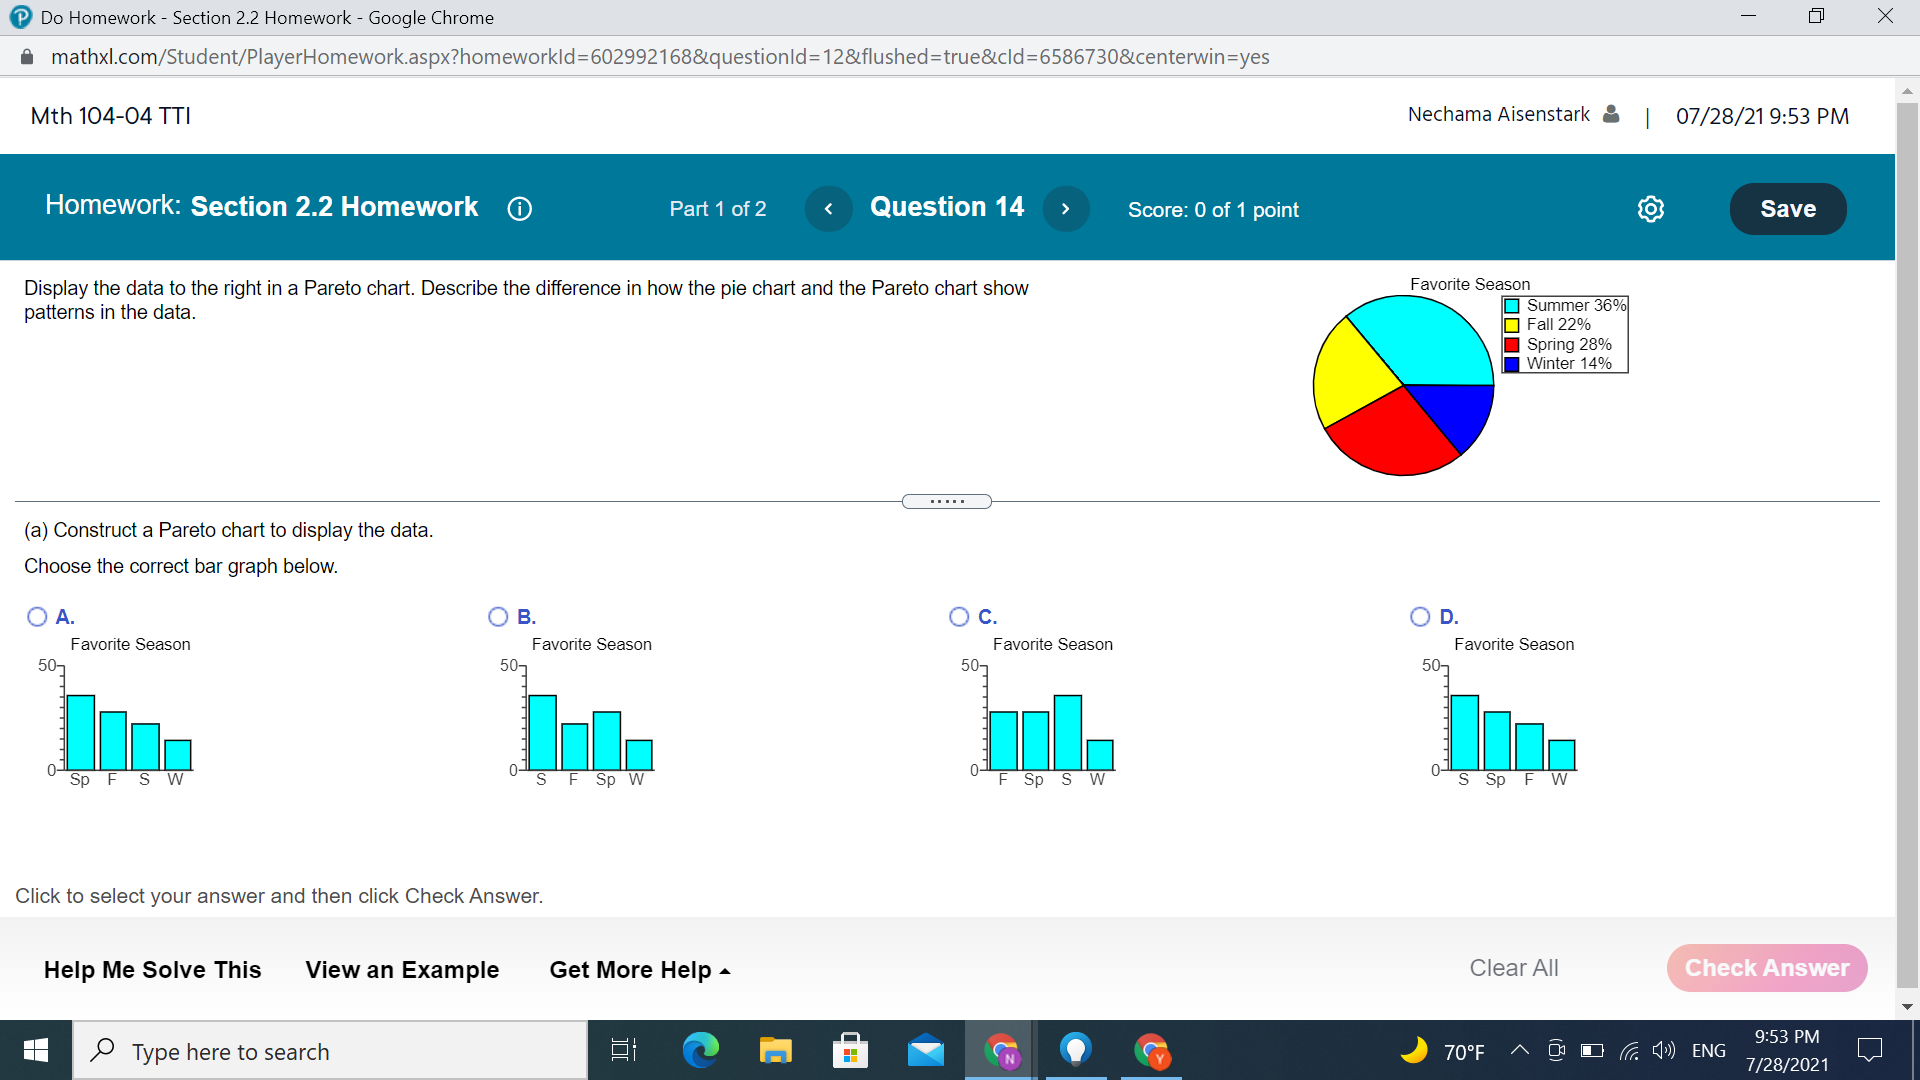
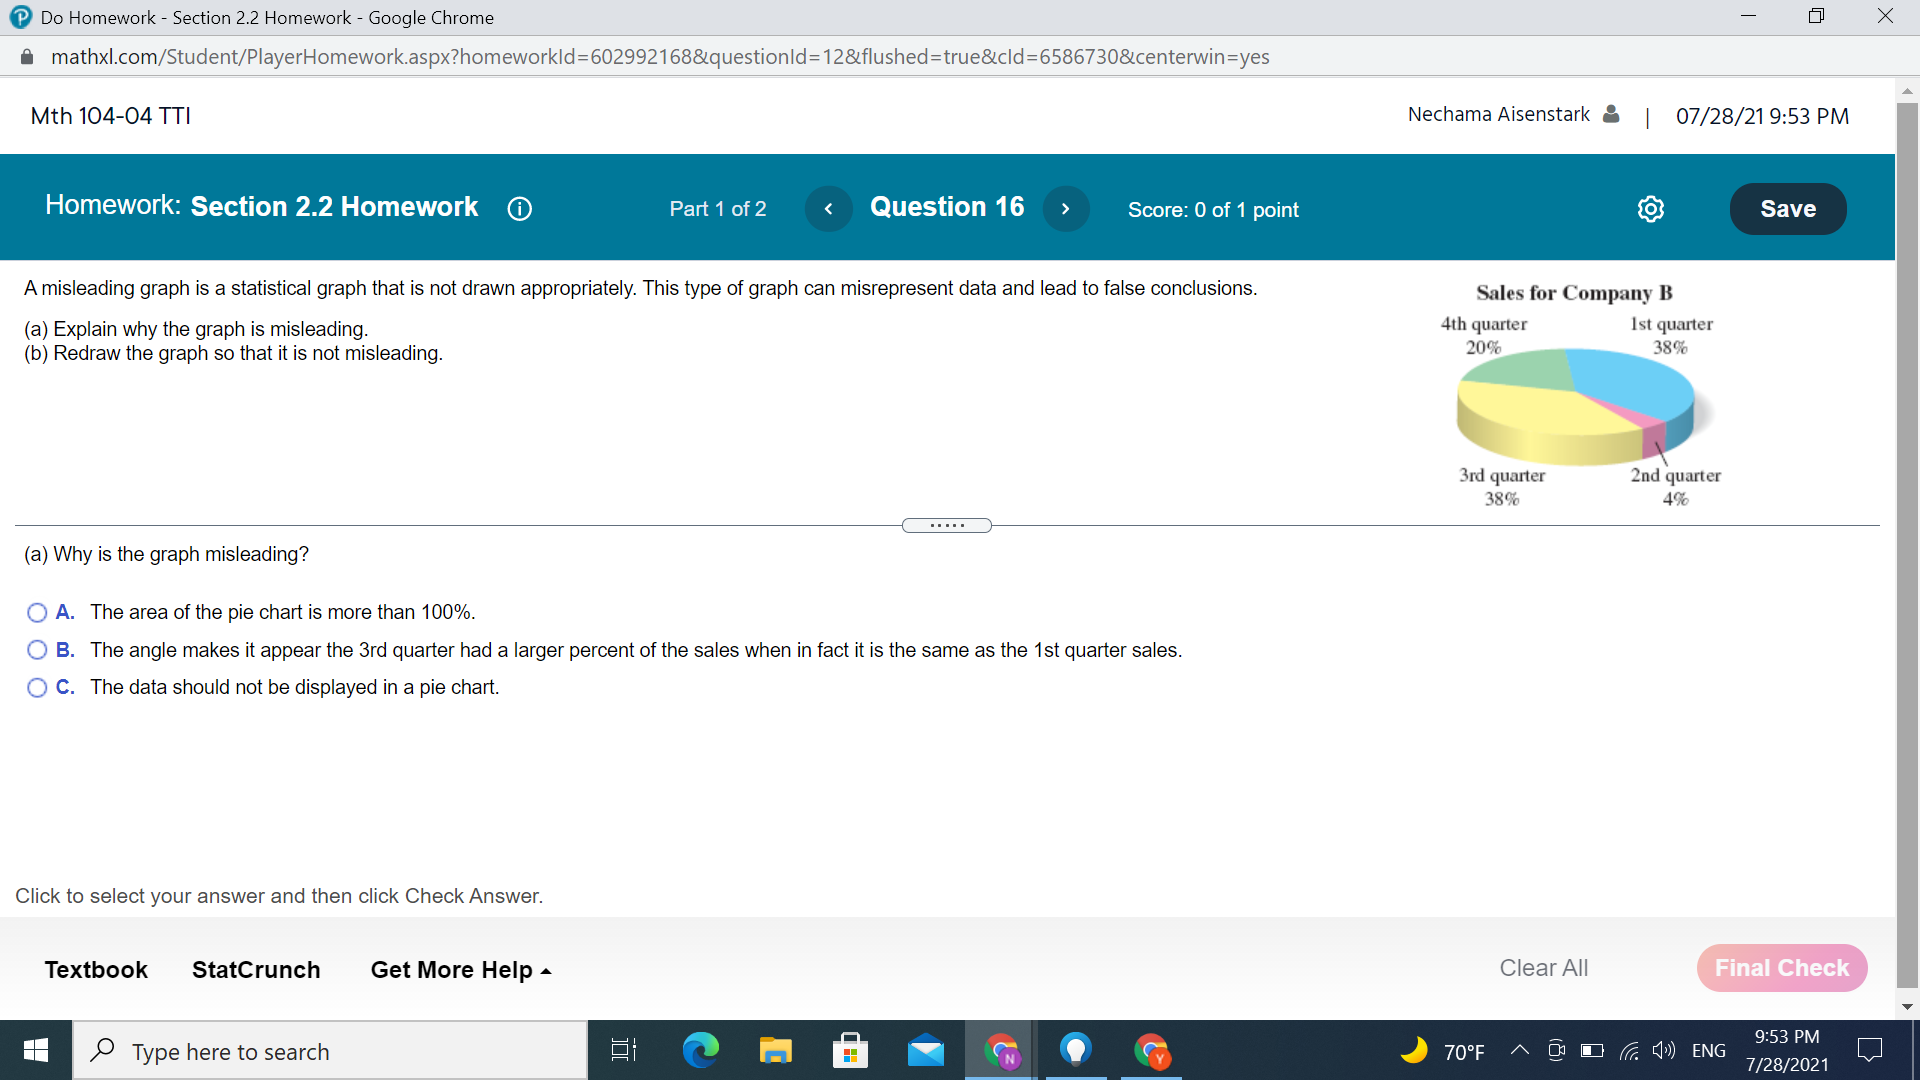
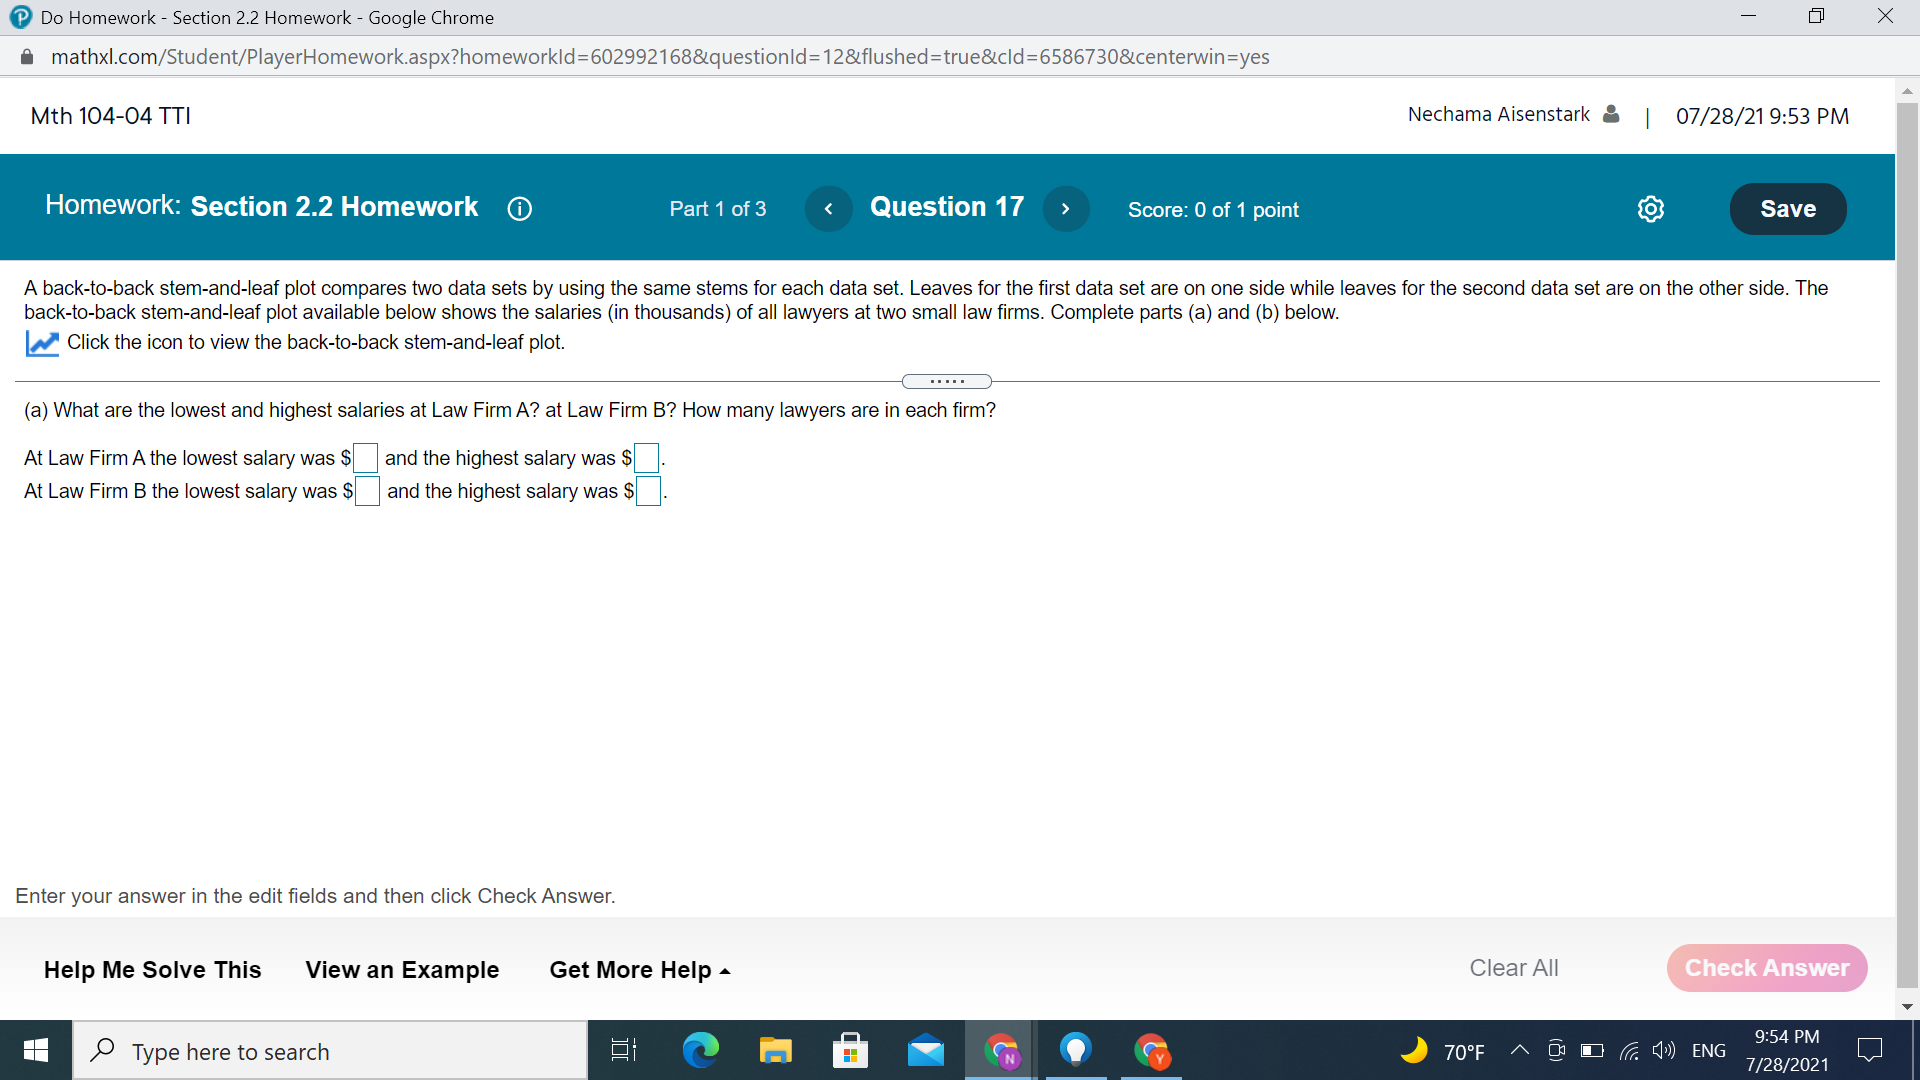
Hub Daemen Do Homework - Section 2.2 Homework - Google Chrome - X X - cao mathxl.com/Student/PlayerHomework.aspx?homeworkld=602992168&questionld=9&flushed=false&cld=6586730¢erwin=yes .. . Mth 104-04 TTI Nechama Aisenstark & | 07/28/219:39 PM Name: Homework: Section 2.2 Question 9 Score: 0 of 1 point Save Due: Homework Part 1 of 2 Last Worked The medal counts for five countries at a recent international sports competition include countries A (35 medals), B (61 medals), C (117 medals), D (51 medals), and E Current Scor (79 medals) . Use a Pareto chart to display the data. Describe any patterns. Attempts: Which Pareto chart below displays the data? O A. O B. Q Medal Counts Medal Counts 120- 120- 100- 100- Question 80- 80- 60- Question 40- 20- 20- TO Question TO C E B D A E A B D C Country Country Question O c. OD. Question Medal Counts Medal Counts 120- 120- 100- 100 80- 80- Medals 60- Medals 60- 40- 40- 20- 20 OK Click to select your answer and then click Check Answer. Help Me Solve This View an Example Get More Help - Clear All Check Answer 9:39 PM Type here to search 70OF DJ ( ()) ENG 7/28/2021Do Homework - Section 2.2 Homework - Google Chrome X mathxl.com/Student/PlayerHomework.aspx?homeworkld=602992168&questionld=12&flushed=true&cld=6586730¢erwin=yes Mth 104-04 TTI Nechama Aisenstark & | 07/28/219:52 PM Homework: Section 2.2 Homework O Part 1 of 2 Question 12 Score: 0 of 1 point Save Use a time series chart to display the data shown in the table available below. The data represent the numbers of bachelor degrees in engineering (in thousands) conferred in a country. Describe any patterns. Click the icon to view the engineering degrees data. . . .. . Which time series chart below displays the data? O A. Engineering Degrees O B. Engineering Degrees 110- 110- 100- 100- Degrees (in thousands) 90- Degrees (in thousands) 90- 80- 70- 70 2005 2007 2009 2011 2013 2015 2005 2007 2009 2011 2013 2015 Year Year O C. Engineering Degrees O D. Engineering Degrees 110- 110- 100- 100- egrees (in thousands) egrees (in thousands) 90- 90- 80- 80- 70- 70- Click to select your answer and then click Check Answer. Help Me Solve This View an Example Get More Help - Clear All Check Answer 9:53 PM Type here to search 70OF D (" ()) ENG 7/28/2021Do Homework - Section 2.2 Homework - Google Chrome - X mathxl.com/Student/PlayerHomework.aspx?homeworkld=602992168&questionld=12&flushed=true&cld=6586730¢erwin=yes Mth 104-04 TTI Nechama Aisenstark & | 07/28/219:53 PM Homework: Section 2.2 Homework O Part 1 of 2 Question 12 Score: 0 of 1 point Save Use a time series chart to display the data shown in the table available below The data represent the numbers of bachelor degrees in engineering (in thousands) conferred in a country. Describe any patterns. Click the icon to view the engineering degrees data - X Engineering Degrees Data Which time series chart below displays the data? e O A. Engineering Degrees Year Degrees 110- 2008 74.4 100- 2009 74.8 2010 80.1 Degrees (in thousands) 90- 201 82.2 80- 2012 87.9 70- 2013 93.6 2005 2007 2009 2011 2013 2015 Year 2014 98.3 2015 105.8 O C. Engineering Degrees 110- 100- Q egrees (in thousands) 90- Print Done 80- 70- Click to select your answer and then click Check Answer. Help Me Solve This View an Example Get More Help - Clear All Check Answer Type here to search O 9:53 PM 70OF DO " ()) ENG 7/28/2021Do Homework - Section 2.2 Homework - Google Chrome - X mathxl.com/Student/PlayerHomework.aspx?homeworkld=602992168&questionld=12&flushed=true&cld=6586730¢erwin=yes Mth 104-04 TTI Nechama Aisenstark & | 07/28/219:53 PM Homework: Section 2.2 Homework O Part 1 of 2 Question 13 Score: 0 of 1 point Save Next Question Display the accompanying data in a dot plot. Describe the differences in how the stem-and-leaf plot and the dot plot s data. Click the icon to view the data. . . . . . Construct a dot plot. Choose the correct graph below. O A. O B. O T N- W - O C. OD. 10 20 4 W- N- Click to select your answer and then click Check Answer. Help Me Solve This View an Example Get More Help - Clear All Check Answer Type here to search 9:53 PM 70OF DO " ()) ENG 7/28/2021Do Homework - Section 2.2 Homework - Google Chrome - X mathxl.com/Student/PlayerHomework.aspx?homeworkld=602992168&questionld=12&flushed=true&cld=6586730¢erwin=yes Mth 104-04 TTI Nechama Aisenstark & | 07/28/219:53 PM Homework: Section 2.2 Homework O Part 1 of 2 Question 13 Score: 0 of 1 point Save Display the accompanying data in a dot plot. Describe the differences in how the stem-and-leaf plot and the dot plot show patterns in the data. Click the icon to view the data. X Stem-and-Leaf Plot Construct a dot plot. Choose the correct graph below. O A. Camcorder Screen Sizes (in inches) 1 5 20 2 557 7 7 7 7 7 7 7 7 WN O T 3 2222244 W - O C. Key: 1/ 5 = 1.5 TTTTTT TTTTTTTTT 10 20 40 Print Done W- Click to select your answer and then click Check Answer. Help Me Solve This View an Example Get More Help - Clear All Check Answer Type here to search N 9:53 PM 70OF DO " ()) ENG 7/28/2021Do Homework - Section 2.2 Homework - Google Chrome - X mathxl.com/Student/PlayerHomework.aspx?homeworkld=602992168&questionld=12&flushed=true&cld=6586730¢erwin=yes Mth 104-04 TTI Nechama Aisenstark & | 07/28/219:53 PM Homework: Section 2.2 Homework O Part 1 of 2 Question 14 Score: 0 of 1 point Save Display the data to the right in a Pareto chart. Describe the difference in how the pie chart and the Pareto chart show Favorite Season patterns in the data. Summer 36% Fall 22% Spring 28% Winter 14% . . . . . (a) Construct a Pareto chart to display the data. Choose the correct bar graph below. O A. O B. O c. OD. Favorite Season Favorite Season Favorite Season Favorite Season 50- 50- 50- 50- TO Sp F S S F Sp W F Sp S W S Sp F W Click to select your answer and then click Check Answer. Help Me Solve This View an Example Get More Help - Clear All Check Answer Type here to search 9:53 PM 70OF DO " ()) ENG 7/28/2021Do Homework - Section 2.2 Homework - Google Chrome - X mathxl.com/Student/PlayerHomework.aspx?homeworkld=602992168&questionld=12&flushed=true&cld=6586730¢erwin=yes Mth 104-04 TTI Nechama Aisenstark & | 07/28/219:53 PM Homework: Section 2.2 Homework O Part 1 of 2 Question 15 Score: 0 of 1 point Save A misleading graph is a statistical graph that is not drawn appropriately. This type of graph can misrepresent data and lead to false conclusions. Sales for Company A (a) Explain why the graph is misleading. 130- (b) Redraw the graph so that it is not misleading. Sales (in $1000) 90-TI 3rd 2nd 1st 4th Quarter (a) Choose the correct answer below. O A. The large gap in the vertical axis makes it appear that the sales for the 3rd quarter are disproportionately larger than the other quarters. O B. The area for the 3rd quarter sales is drawn artificially larger than the area for the other quarters. O C. There is a gap between the quarter values. O D. The quarters displayed out of order. Click to select your answer and then click Check Answer. Textbook StatCrunch Get More Help - Clear All Check Answer 9:53 PM Type here to search 70OF ~ DO . ()) ENG 7/28/2021Do Homework - Section 2.2 Homework - Google Chrome - X mathxl.com/Student/PlayerHomework.aspx?homeworkld=602992168&questionld=12&flushed=true&cld=6586730¢erwin=yes Mth 104-04 TTI Nechama Aisenstark & | 07/28/219:53 PM Homework: Section 2.2 Homework O Part 1 of 2 Question 16 Score: 0 of 1 point Save A misleading graph is a statistical graph that is not drawn appropriately. This type of graph can misrepresent data and lead to false conclusions. Sales for Company B (a) Explain why the graph is misleading. 4th quarter 1st quarter (b) Redraw the graph so that it is not misleading. 20% 38% 3rd quarter 2nd quarter 38% 4% (a) Why is the graph misleading? O A. The area of the pie chart is more than 100%. O B. The angle makes it appear the 3rd quarter had a larger percent of the sales when in fact it is the same as the 1st quarter sales. O C. The data should not be displayed in a pie chart. Click to select your answer and then click Check Answer. Textbook StatCrunch Get More Help - Clear All Final Check Type here to search 70OF ~ 9:53 PM D ( ()) ENG 7/28/2021Do Homework - Section 2.2 Homework - Google Chrome - X mathxl.com/Student/PlayerHomework.aspx?homeworkld=602992168&questionld=12&flushed=true&cld=6586730¢erwin=yes Mth 104-04 TTI Nechama Aisenstark & | 07/28/219:53 PM Homework: Section 2.2 Homework O Part 1 of 3 Question 17 Score: 0 of 1 point Save A back-to-back stem-and-leaf plot compares two data sets by using the same stems for each data set. Leaves for the first data set are on one side while leaves for the second data set are on the other side. The back-to-back stem-and-leaf plot available below shows the salaries (in thousands) of all lawyers at two small law firms. Complete parts (a) and (b) below. Click the icon to view the back-to-back stem-and-leaf plot. (a) What are the lowest and highest salaries at Law Firm A? at Law Firm B? How many lawyers are in each firm? At Law Firm A the lowest salary was $ and the highest salary was $ At Law Firm B the lowest salary was $ and the highest salary was $ Enter your answer in the edit fields and then click Check Answer. Help Me Solve This View an Example Get More Help - Clear All Check Answer Type here to search 9:54 PM 70OF ~ DO . ()) ENG 7/28/2021
Step by Step Solution
There are 3 Steps involved in it

Get step-by-step solutions from verified subject matter experts