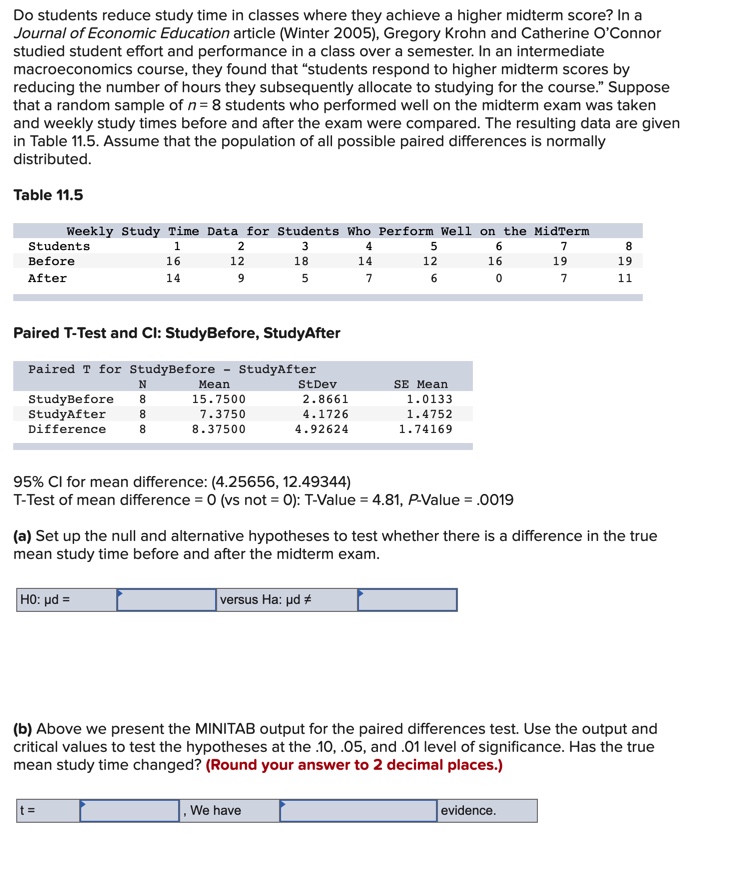
Can you help with this practice question?
Do students reduce study time in classes where they achieve a higher midterm score? In a Journal of Economic Education article (Winter 2005), Gregory Krohn and Catherine O'Connor studied student effort and performance in a class over a semester. In an intermediate macroeconomics course, they found that "students respond to higher midterm scores by reducing the number of hours they subsequently allocate to studying for the course." Suppose that a random sample of n= 8 students who performed well on the midterm exam was taken and weekly study times before and after the exam were compared. The resulting data are given in Table 11.5. Assume that the population of all possible paired differences is normally distributed. Table 11.5 Weekly Study Time Data for Students Who Perform Well on the MidTerm Students 1 2 3 6 7 B Before 16 12 18 14 12 16 19 19 After 14 5 7 11 Paired T-Test and Cl: StudyBefore, StudyAfter Paired T for StudyBefore - StudyAfter N Mean StDev SE Mean StudyBefore 15 . 7500 2. 8661 1. 0133 StudyAfter 00 00 00 7.3750 4. 1726 1. 4752 Difference 8. 37500 4.92624 1. 74169 95% CI for mean difference: (4.25656, 12.49344) T-Test of mean difference = 0 (vs not = 0): T-Value = 4.81, P-Value = .0019 (a) Set up the null and alternative hypotheses to test whether there is a difference in the true mean study time before and after the midterm exam. HO: ud = versus Ha: ud # (b) Above we present the MINITAB output for the paired differences test. Use the output and critical values to test the hypotheses at the .10, .05, and .01 level of significance. Has the true mean study time changed? (Round your answer to 2 decimal places.) t = We have evidence.(c) Use the p-value to test the hypotheses at the 10, .05, and .01 level of significance. How much evidence is there against the null hypothesis? There is evidence against the null hypothesis