

Question
Can you Perceived Stress Problem A study was completed to look at perceived stress of workers at a local company. The results of the study


Can you
Perceived Stress Problem
A study was completed to look at perceived stress of workers at a local company. The results of the study can be located in the excel document titled Perceived Stress. The study looked at the following variables: current smoker (1 for yes, 0 for no), management position (1 for yes, 0 for no), gender, age (in years), mean arterial blood pressure, weight (in Kg), and perceived stress level (Low, medium, high).
Use the excel file "Perceived Stress" to answer the following questions. Place answers in a different color font so they are easy to identify.
- Perceived Stress would be considered which type of variable?
- a categorical, nominal variable.
- a categorical, ordinal variable.
- a numerical, discrete variable.
- a numerical, continuous variable.
- Gender would be considered which type of variable?
- a categorical, nominal variable.
- a categorical, ordinal variable.
- a numerical, discrete variable.
- a numerical, continuous variable.
- Age would be considered which type of variable?
- a categorical, nominal variable.
- a categorical, ordinal variable.
- a numerical, discrete variable.
- a numerical, continuous variable.
- Weight would be considered which type of variable?
- a categorical, nominal variable.
- a categorical, ordinal variable.
- a numerical, discrete variable.
- a numerical, continuous variable.
- Current smoker would be considered which type of variable?
- a categorical, nominal variable.
- a categorical, ordinal variable.
- a numerical, discrete variable.
- a numerical, continuous variable.
- The arithmetic mean for weight in this sample is ______________________.
- 62.70
- 64.00
- 65.46
- 66.49
- The mode for weight is __________________.
- 0
- 56.07
- 65.46
- 73.00
- The standard deviation for mean arterial pressure is __________________.
- 13.71
- 13.29
- 13.30
- 14.39
- Is weight right- or left-screwed? _______________ .
- Right-screwed
- Left-screwed
- Not screwed
- The arithmetic mean for age in this sample is ______________________.
- 62.70
- 64.00
- 65.46
- 66.49
- The median age is ____________________________
- 64.00
- 66.49
- 65.46
- 66.50
- The skewness statistic for mean arterial pressure is ___________________.
- -0.3969
- -0.0611
- 0.0320
- 0.0325
- Is age leptokurtic or platykurtic? _______________________
- leptokurtic
- platykurtic
- neither
- The range for weight is ________ .
- 49.89
- 60.10
- 71.11
- 75.00
- The variance of ages is ________ .
- 176.96
- 187.87
- 196.87
- 207.14
- The coefficient of variation of age is ________percent.
- 18.78%
- 21.86%
- 21.42%
- 25.86%
- The five-number summary of age consists of _____, ______, _____, _____, _____.
- 20, 53, 64, 74, 95
- 20, 54 ,65, 75, 95
- 20, 53 ,63, 74, 95
- 20, 54 ,64, 75, 95
- The five-number summary of weight consists of ______, _____, _____, _____, _____.
- 30.44, 56.07, 66.49, 71.11, 101.55
- 30.44, 54.44 ,65.46, 75.83, 101.55
- 30.44, 56.07 ,65.46, 71.11, 101.55
- 30.44, 54.44 ,66.49, 75.83, 101.55
- The coefficient of variation of weight is ________percent.
- 18.78%
- 20.32%
- 21.42%
- 21.86%
Construct a boxplot for age in Excel
Construct a boxplot for weight in Excel
Construct a frequency distribution and a cumulative percentage distribution in Excel using the following classes: under 30, 30 to 39, 40 to 49, 50 to 59, 60 to 69, 70 +
Construct a histogram and cumulative percentage polygon in Excel for the defects data, using the following classes: under 30, 30 to 39, 40 to 49, 50 to 59, 60 to 69, 70 +
- What percent of the employees are under the age of 50?
- 17.83%
- 25.01%
- 32.70%
- 38.61%
- What percent of the employees are over 39 but less than 60?
- 17.83%
- 25.01%
- 32.70%
- 38.61%
Construct a Pivot Table in Excel to answer the following questions
- How many females were in the study?
- 309
- 384
- 411
- 564
- What percent of study participants were male and indicated a perceived stress level of high?
- 0.2511
- 0.5619
- 0.3865
- 0.2300
- Given a participant indicated a low stress level what is the probability they were male?
- 0.6415
- 0.5619
- 0.4220
- 0.2511
- What percent of study participants were male?
- 0.2511
- 0.4093
- 0.5949
- 0.6809
- What percent of study participants indicated they were managers?
- 0.5949
- 0.2405
- 0.6809
- 0.7806
- Given a participant indicated being a manager what is the probability they were female?
- 0.3289
- 0.1953
- 0.4051
- 0.2405
- What percent of study participants were current smokers and indicated a perceived stress level of high?
- 0.1211
- 0.4393
- 0.0496
- 0.4093
- What percent of study participants indicated that they are none smokers?
- 0.8871
- 0.1129
- 0.4093
- 0.1994
- What percent of study participants indicated that they were females and not a current smoker?
- 0.4299
- 0.4019
- 0.8871
- 0.3565
Construct a Stem- and-leaves diagram in Excel for age and answer the following questions
- Which stem has the most leaves?
- 2
- 6
- 7
- 9
- Which stem has the fewest leaves?
- 2
- 6
- 7
- 9
- How many leaves are there for the stem of 3?
- 32
- 36
- 40
- 44
- How many leaves are there for the stem of 2?
- 10
- 12
- 16
- 20
Binomial Distribution
A certain type of new business succeeds 60% of the time. Suppose that 3 such businesses open
(where they do not compete, so it is reasonable to believe that their relative successes would be
independent).
- The probability that all 3 businesses succeed is ________.
- 0.216
- 0.456
- 0.936
- 1.00
- The probability that all 3 businesses fail is ________.
- 0.064
- 0.216
- 0.456
- 0.936
- The probability that at least 1 business succeeds is ________.
- 0.064
- 0.288
- 0.456
- 0.936
- The probability that exactly 1 business succeeds is ________.
- 0.096
- 0.288
- 0.352
- 0.60
Probability Distribution
The following table contains the probability distribution for X= the number of retransmissions
necessary to successfully transmit a 1024K data package through a network.
| X | 0 | 1 | 2 | 3 |
| P(X) | 0.35 | 0.35 | 0.25 | 0.05 |
39. The probability of no retransmissions is ________.
- 0.35
- 0.65
- 0.70
- 1.00
40. The probability of at least one retransmission is ________.
- 0.35
- 0.65
- 0.70
- 1.00
41. The probability of no more than one retransmission is ________.
- 0.35
- 0.65
- 0.70
- 1.00
42. The mean or expected value for the number of retransmissions is ________.
- 0.35
- 0.65
- 0.70
- 1.00
Poisson Distribution
The quality control manager of Green Bulbs Inc. is inspecting a batch of energy saving compact
fluorescent light bulbs. When the production process is in control, the mean number of bad bulbs per shift is 6.0.
43. What is the probability that any shift being inspected has produced 4.0 bad bulbs.
- 0.0446
- 0.1339
- 0.2851
- 0.5543
44. What is the probability that any shift being inspected has produced fewer than 5.0 bad bulbs.
- 0.0446
- 0.1339
- 0.2851
- 0.5543
45. What is the probability that any shift being inspected has produced no more than 2.0 bad bulbs.
- 0.0446
- 0.1339
- 0.0892
- 0.0620
46. What is the probability that any shift being inspected has produced at least 6.0 bad bulbs
- 0.1339
- 0.2851
- 0.5543
- 0.6578
47. What is the probability that any shift being inspected has produced between 5.0 and 8.0 inclusive bad bulbs.
- 0.5543
- 0.5622
- 0.6554
- 0.7014
Normal Distribution
Ball bearings are manufactured with a mean diameter of 6 millimeters (mm). Because of the inherent manufacturing process variability, the lots of bearings are approximately normally distributed with a standard deviation of 0.03 mm.
48. What proportion of ball bearings has a diameter of greater than 6 mm?
- 0.4562
- 0.50
- 0.6554
- 0.7500
49. What proportion of ball bearings has a diameter of more than 6.03 mm?
- 0.1339
- 0.1587
- 0.84134
- 8.066
50. Any bearing having a diameter of less than 5.95 mm or greater than 6.05 mm are discarded. What proportion of the bearings will be discarded?
- 0.0956
- 0.9522
- 1
- 3.159
51. Using the result of the previous question, if 40,000 ball bearings were to be manufactured, how many would the manager have to discard?
- 3,824
- 38,088
- 40,000
- 126,360
Central Limit Theorem
The mean selling price of new homes in a small town over a year was $115,000. The population
standard deviation was $25,000. A random sample of 100 new home sales from this city was taken.
52. What is the sample error of the mean?
- 25
- 250
- 2,500
- 25,000
53. What is the probability that the sample mean selling price was more than $110,000?
- 0.0228
- 0.5763
- 0.7881
- 0.9772
54. What is the probability that the sample mean selling price was between $113,000 and $117,000?
- 0.2119
- 0.5763
- 0.3446
- 0.7881
55. What is the probability that the sample mean selling price was more than $116,000?
- 0.0002
- 0.5763
- 0.3446
- 0.6554
Confidence Interval (t distribution)
The actual voltages of power packs labeled as 12 volts are as follows: 11.77, 11.90, 11.64, 11.84,
12.13, 11.99, and 11.77.
56. A confidence interval for this sample would be based on the tdistribution with _____ degrees of freedom
- 4
- 5
- 6
- 7
57. The critical value for a 99% confidence interval for this sample is __________.
- 4.6041
- 3.7074
- 4.0321
- 3.4995
58. A 99% confidence interval for the mean voltage of the power packs is from _____ to ______.
- 8.14 to 15.56
- 9.56 to 14.26
- 10.02 to 13.56
- 11.64 to 12.06
Confidence Interval, Proportion
A university wanted to find out the percentage of students who felt comfortable reporting cheating by their fellow students. A survey of 2,800 students was conducted and the students were asked if they felt comfortable reporting cheating by their fellow students. The results were 1,344 answered "Yes" and 1,456 answered "no".
59. The critical value for a 99% confidence interval for this sample is __________.
- 1.28
- 1.65
- 1.96
- 2.58
60. The sampling error of a 99% confidence interval for the proportion of student population who feel comfortable reporting cheating by their fellow students is __________.
- 0.0121
- 0.0244
- 0.0156
- 0.0185
61. A 99% confidence interval for the proportion of the student population who feel comfortable reporting cheating by their fellow students is from __________ to __________.
- 0.4556 to 0.5044
- 0.4615 to 0.4985
- 0.4644 to 0.4956
- 0.4680 to 0.4921
Hypothesis Testing: One-Sample
A student claims that he can correctly identify whether a person is a business major or an agriculture major by the way the person dresses. Suppose in actuality that if someone is a business major, he can correctly identify that person as a business major 87% of the time. When a person is an agriculture major, the student will incorrectly identify that person as a business major 16% of the time. Presented with one person and asked to identify the major of this person (who is either a business or an agriculture major), he considers this to be a hypothesis test with the null hypothesis being that the person is a business major and the alternative that the person is an agriculture major.
62. What would be a Type I error?
a) Saying that the person is a business major when in fact the person is a business major.
b) Saying that the person is a business major when in fact the person is an agriculture major.
c) Saying that the person is an agriculture major when in fact the person is a business major.
d) Saying that the person is an agriculture major when in fact the person is an agriculture major.
63. What would be a Type II error?
a) Saying that the person is a business major when in fact the person is a business major.
b) Saying that the person is a business major when in fact the person is an agriculture major.
c) Saying that the person is an agriculture major when in fact the person is a business major.
d) Saying that the person is an agriculture major when in fact the person is an agriculture major.
64. What is the "actual level of significance" of the test?
a) 0.13
b) 0.16
c) 0.84
d) 0.87
65. What is the "actual confidence coefficient"?
a) 0.13
b) 0.16
c) 0.84
d) 0.87
66. What is the value of ?
a) 0.13
b) 0.16
c) 0.84
d) 0.87
67. What is the value of ?
a) 0.13
b) 0.16
c) 0.84
d) 0.87
68. What is the power of the test?
a) 0.13
b) 0.16
c) 0.84
d) 0.87
Hypothesis Testing: Two-Sample
Two samples each of size 25 are taken from independent populations assumed to be normally distributed with equal variances. The first sample has a mean of 35.5 and standard deviation of 3.0 while the second sample has a mean of 33.0 and standard deviation of 4.0.
69. The pooled (i.e., combined) variance is _______.
a) 6
b) 2.5
c) 12.5
d) 25
70. The computed tstatistic is _______.
a) 1
b) 2.5
c) 12.5
d) 25
71. There are _______ degrees of freedom for this test.
a) 25
b) 50
c) 36
d) 48
72. The critical values for a two-tail test of the null hypothesis of no difference in the population means at the= 0.05 level of significance are _______.
a) 2.0117
b) 2.0086
c) 1.6759
d) 2.0639
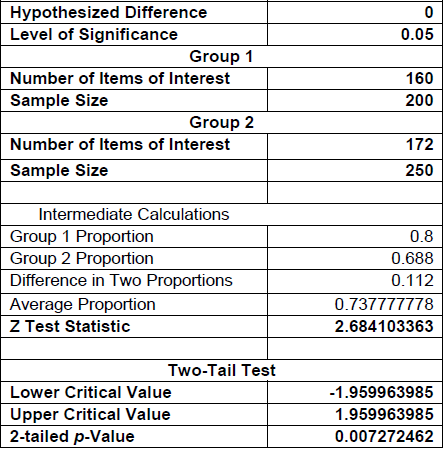
The following EXCEL output contains the results of a test to determine whether the proportions of
satisfied customers at two resorts are the same or different.

Step by Step Solution
There are 3 Steps involved in it
Step: 1

Get Instant Access to Expert-Tailored Solutions
See step-by-step solutions with expert insights and AI powered tools for academic success
Step: 2

Step: 3
Ace Your Homework with AI
Get the answers you need in no time with our AI-driven, step-by-step assistance
Get Started
Calculus Single Variable
Authors: Deborah Hughes Hallett, Deborah Hughes Hallet, Andrew M Gleason, William G McCallum, Daniel E Flath, Patti Frazer Lock, David O Lomen, David Lovelock,
6th Edition
1118748611, 9781118748619