Can you please assist with these questions
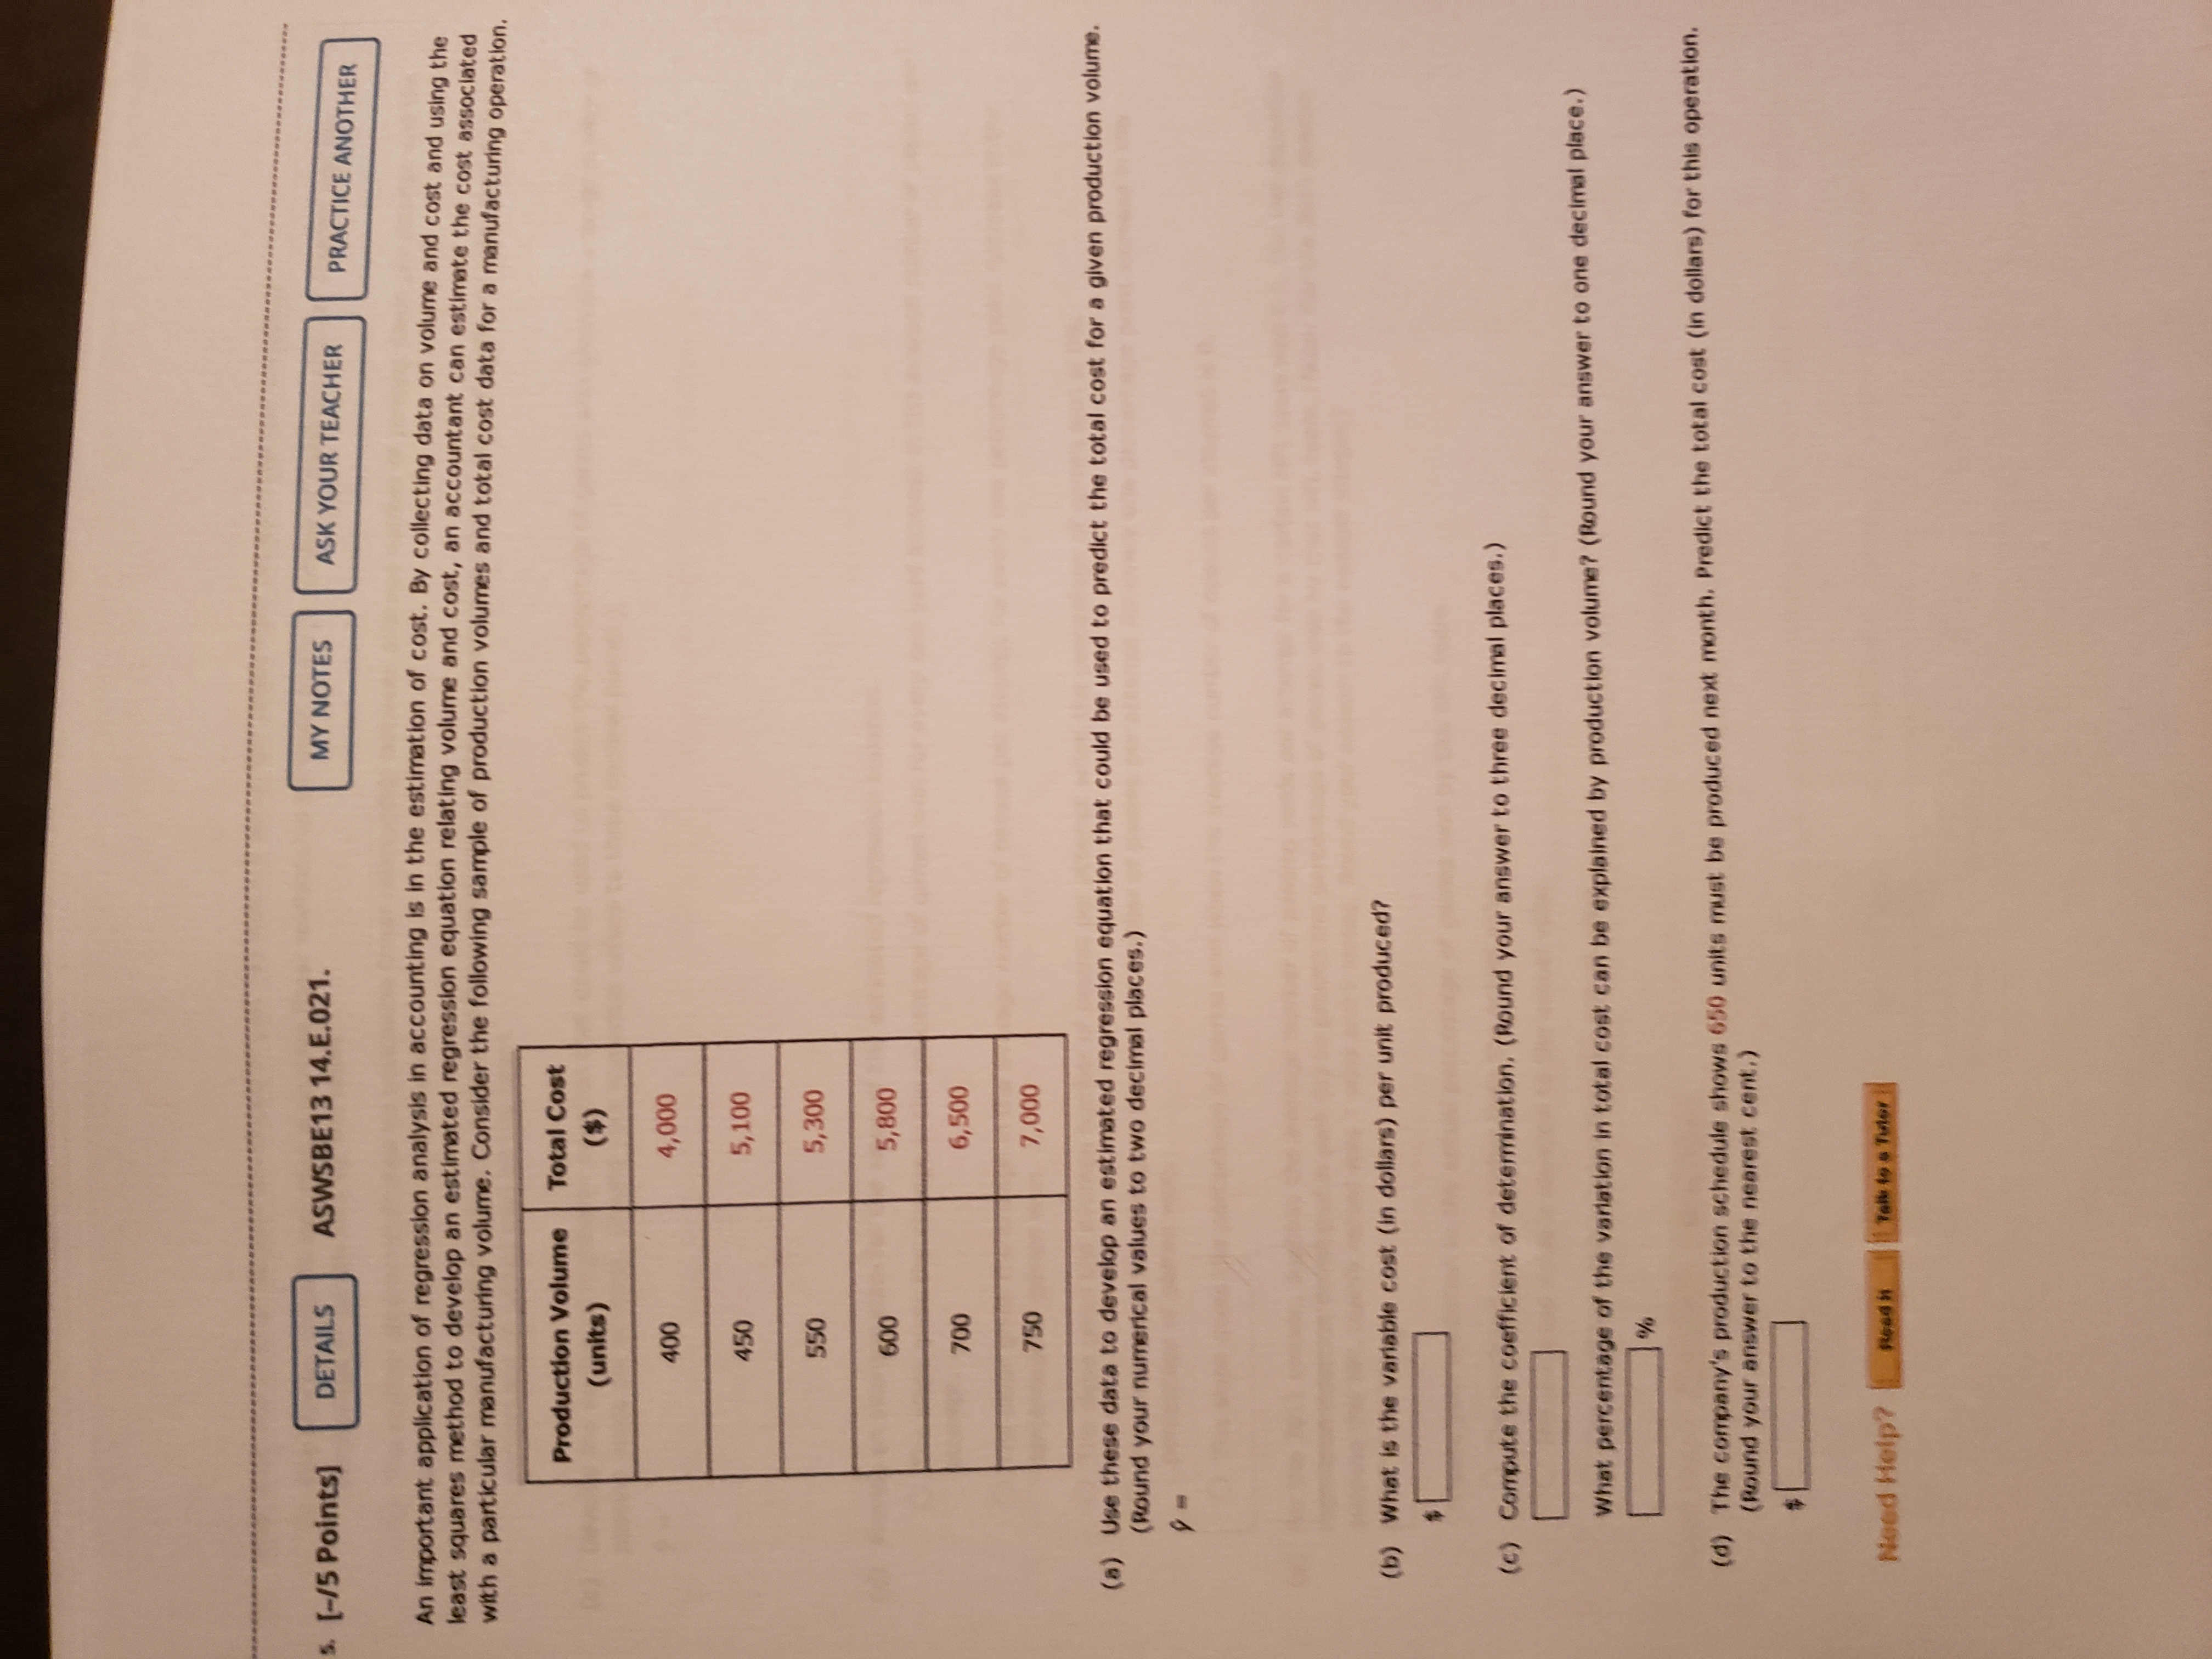
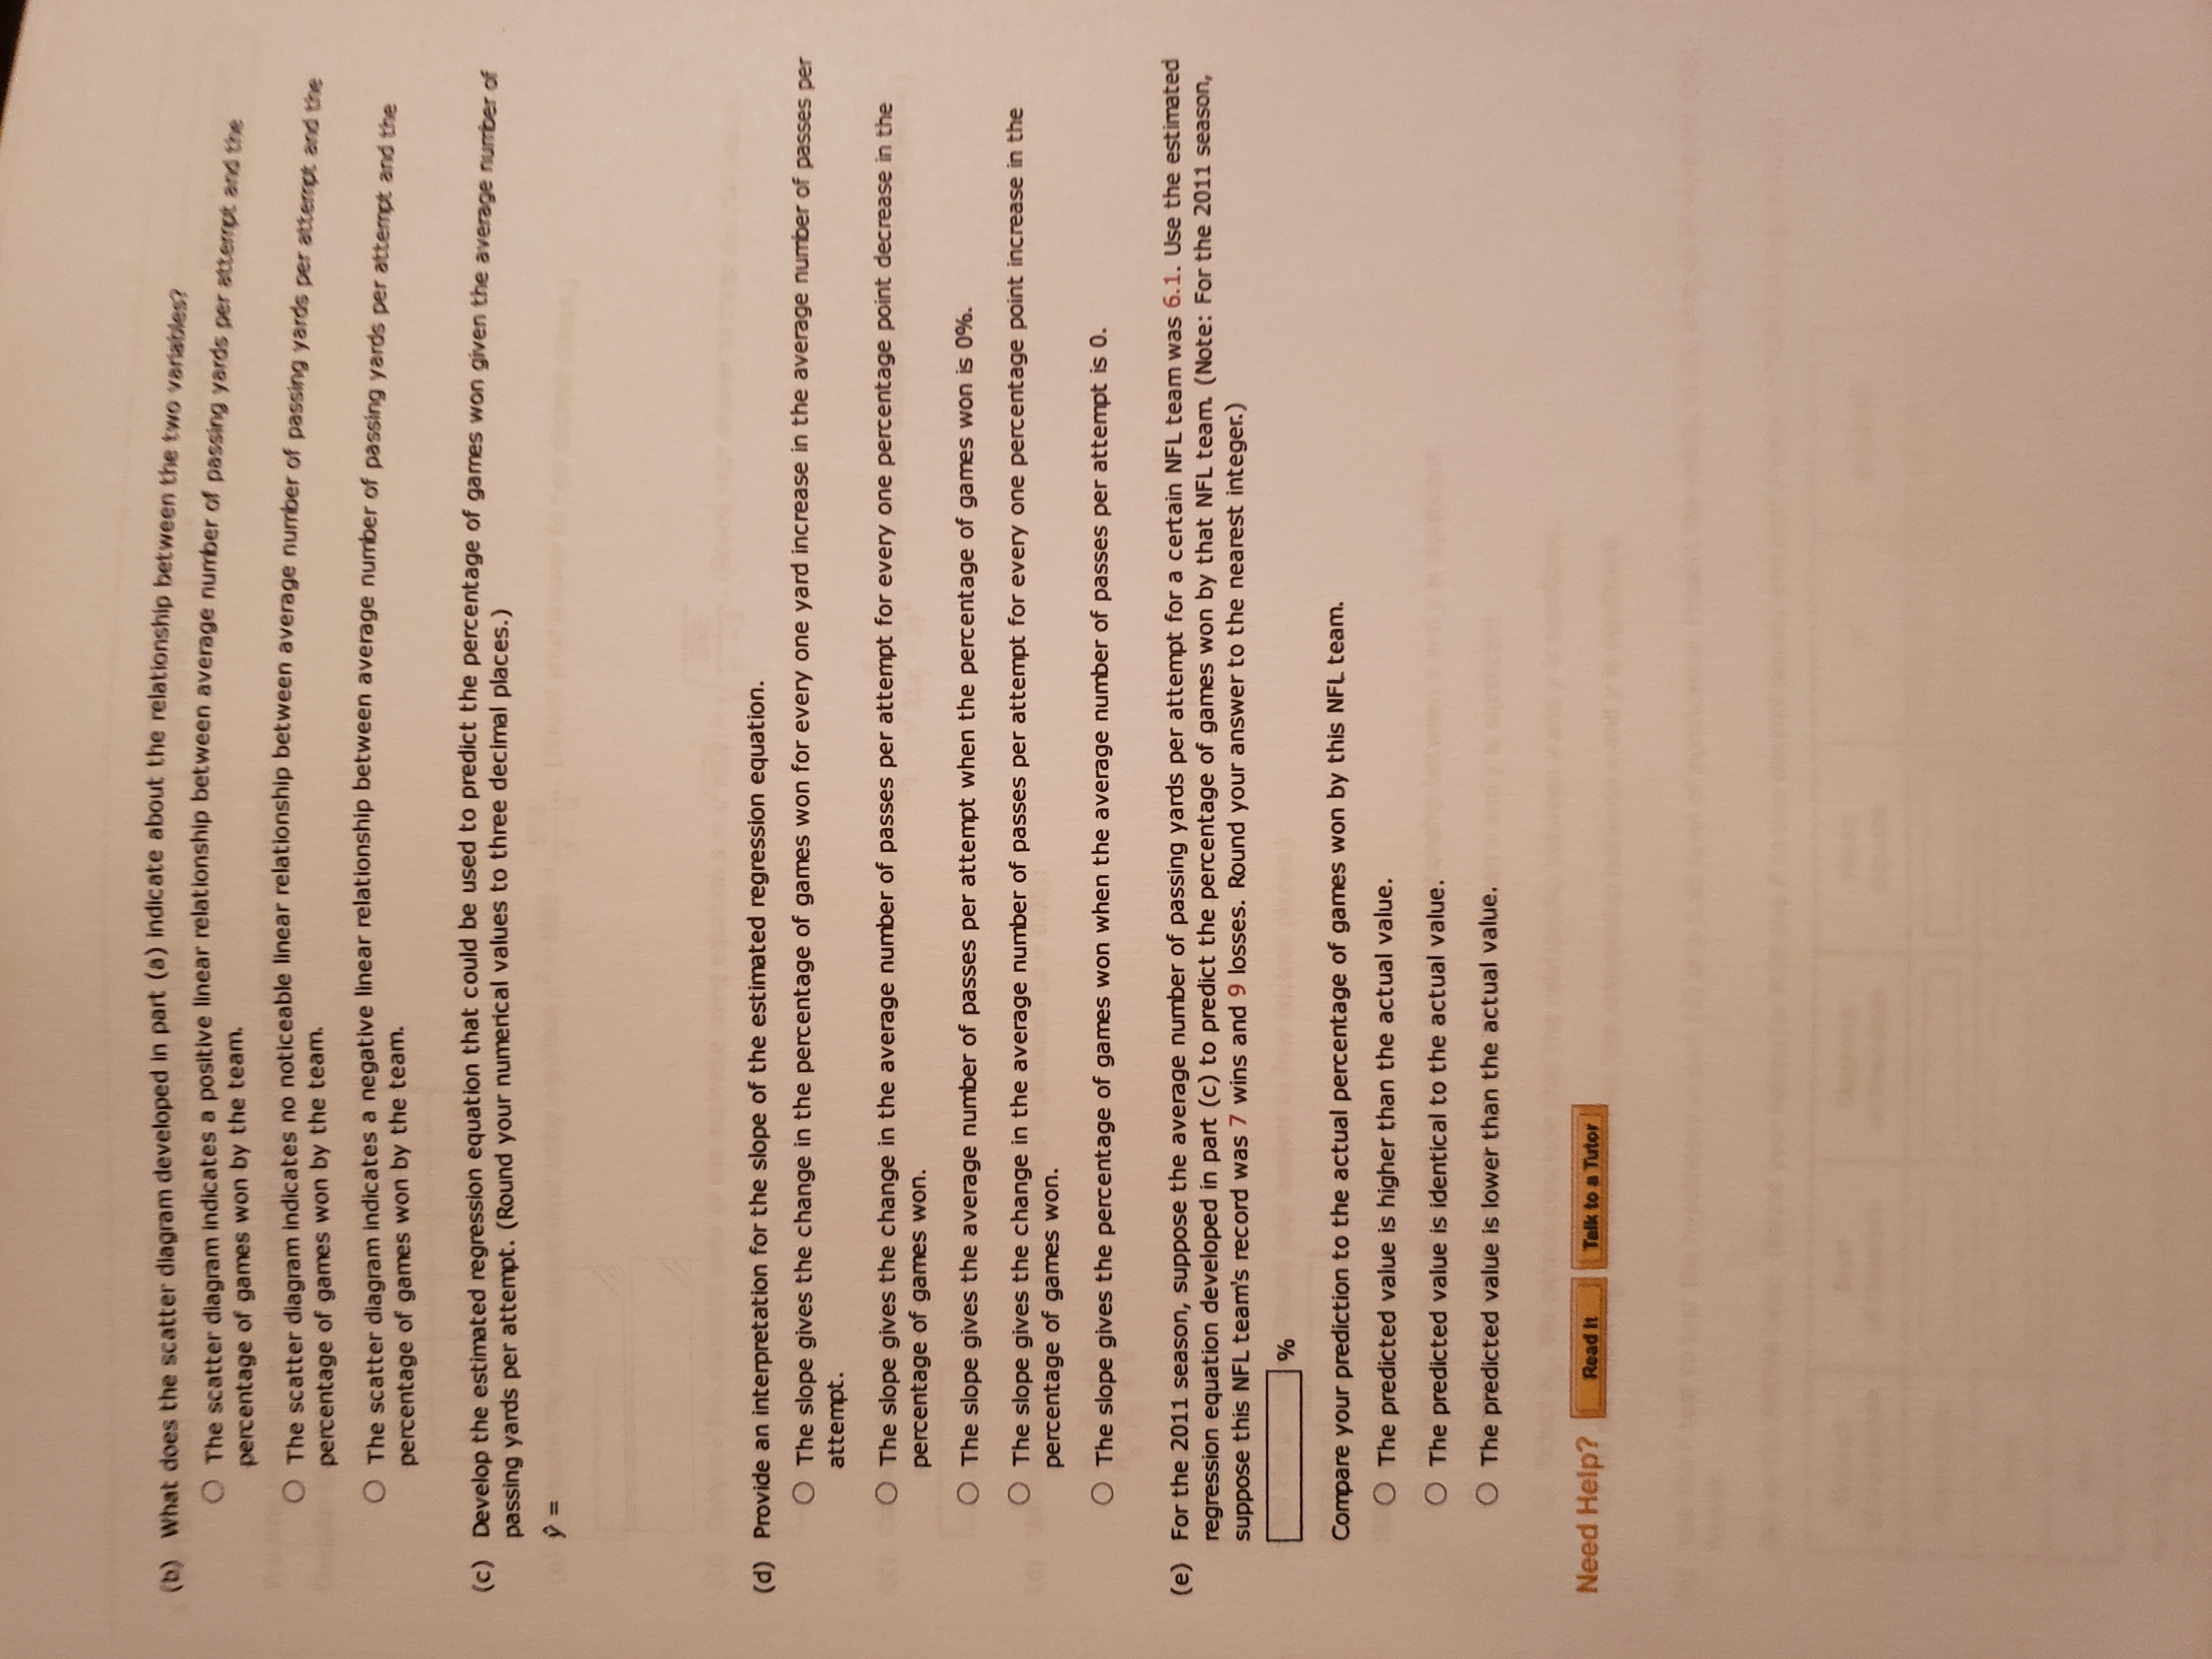
5. [-/5 Points] DETAILS ASWSBE13 14.E.021. MY NOTES ASK YOUR TEACHER PRACTICE ANOTHER An important application of regression analysis in accounting is in the estimation of cost. By collecting data on volume and cost and using the least squares method to develop an estimated regression equation relating volume and cost, an accountant can estimate the cost associated with a particular manufacturing volume. Consider the following sample of production volumes and total cost data for a manufacturing operation. Production Volume Total Cost (units) ($) 400 4,000 450 5,100 550 5,300 600 5,800 700 6,500 750 7,000 (a) Use these data to develop an estimated regression equation that could be used to predict the total cost for a given production volume. (Round your numerical values to two decimal places.) (b) What is the variable cost (in dollars) per unit produced? (c) Compute the coefficient of determination, (Round your answer to three decimal places.) What percentage of the variation in total cost can be explained by production volume? (Round your answer to one decimal place.) (d) The company's production schedule shows 650 units must be produced next month. Predict the total cost (in dollars) for this operation. (Round your answer to the nearest cent.) Need Help? Reed" Talk to s niner(b) What does the scatter diagram developed in part (a) indicate about the relationship between the two variables? The scatter diagram indicates a positive linear relationship between average number of passing yards per atterrot and the percentage of games won by the team. The scatter diagram indicates no noticeable linear relationship between average number of passing yards per atternot and the percentage of games won by the team. The scatter diagram indicates a negative linear relationship between average number of passing yards per atternot and the percentage of games won by the team. (c) Develop the estimated regression equation that could be used to predict the percentage of games won given the average number of passing yards per attempt. (Round your numerical values to three decimal places.) y = (d) Provide an interpretation for the slope of the estimated regression equation. The slope gives the change in the percentage of games won for every one yard increase in the average number of passes per attempt. O The slope gives the change in the average number of passes per attempt for every one percentage point decrease in the percentage of games won. The slope gives the average number of passes per attempt when the percentage of games won is 0%. The slope gives the change in the average number of passes per attempt for every one percentage point increase in the percentage of games won. The slope gives the percentage of games won when the average number of passes per attempt is 0. (e) For the 2011 season, suppose the average number of passing yards per attempt for a certain NFL team was 6.1. Use the estimated regression equation developed in part (c) to predict the percentage of games won by that NFL team. (Note: For the 2011 season, suppose this NFL team's record was 7 wins and 9 losses. Round your answer to the nearest integer.) 1% Compare your prediction to the actual percentage of games won by this NFL team. O The predicted value is higher than the actual value. O The predicted value is identical to the actual value. The predicted value is lower than the actual value. Need Help? Read it Talk to a Tutor