Question: CAN YOU PLEASE EXPLAIN THE ANSWERS Question 5 : (8 Marks) Explain shortly Sharpe Optimal Portfolio. (4 points) Explain shortly Value at Risk (4 points)


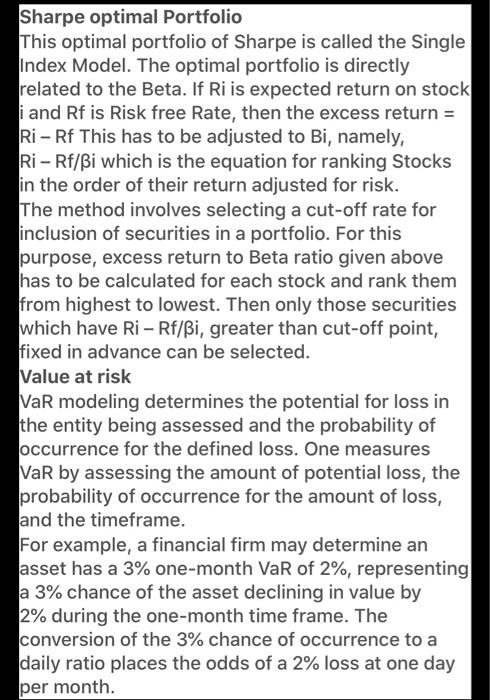
Question 5 : (8 Marks) Explain shortly Sharpe Optimal Portfolio. (4 points) Explain shortly Value at Risk (4 points) Sharpe optimal Portfolio This optimal portfolio of Sharpe is called the Single Index Model. The optimal portfolio is directly related to the Beta. If Ri is expected return on stock i and Rf is Risk free Rate, then the excess return = Ri - Rf This has to be adjusted to Bi, namely, Ri - Rf/Bi which is the equation for ranking Stocks in the order of their return adjusted for risk. The method involves selecting a cut-off rate for inclusion of securities in a portfolio. For this purpose, excess return to Beta ratio given above has to be calculated for each stock and rank them from highest to lowest. Then only those securities which have Ri - Rf/Bi, greater than cut-off point, fixed in advance can be selected. Value at risk VaR modeling determines the potential for loss in the entity being assessed and the probability of occurrence for the defined loss. One measures VaR by assessing the amount of potential loss, the probability of occurrence for the amount of loss, and the timeframe. For example, a financial firm may determine an asset has a 3% one-month VaR of 2%, representing a 3% chance of the asset declining in value by 2% during the one-month time frame. The conversion of the 3% chance of occurrence to a daily ratio places the odds of a 2% loss at one day per month. Question 5 : (8 Marks) Explain shortly Sharpe Optimal Portfolio. (4 points) Explain shortly Value at Risk (4 points) Sharpe optimal Portfolio This optimal portfolio of Sharpe is called the Single Index Model. The optimal portfolio is directly related to the Beta. If Ri is expected return on stock i and Rf is Risk free Rate, then the excess return = Ri - Rf This has to be adjusted to Bi, namely, Ri - Rf/Bi which is the equation for ranking Stocks in the order of their return adjusted for risk. The method involves selecting a cut-off rate for inclusion of securities in a portfolio. For this purpose, excess return to Beta ratio given above has to be calculated for each stock and rank them from highest to lowest. Then only those securities which have Ri - Rf/Bi, greater than cut-off point, fixed in advance can be selected. Value at risk VaR modeling determines the potential for loss in the entity being assessed and the probability of occurrence for the defined loss. One measures VaR by assessing the amount of potential loss, the probability of occurrence for the amount of loss, and the timeframe. For example, a financial firm may determine an asset has a 3% one-month VaR of 2%, representing a 3% chance of the asset declining in value by 2% during the one-month time frame. The conversion of the 3% chance of occurrence to a daily ratio places the odds of a 2% loss at one day per month
Step by Step Solution
There are 3 Steps involved in it

Get step-by-step solutions from verified subject matter experts


