

Answered step by step
Verified Expert Solution
Question
1 Approved Answer
can you please help me QUESTION ONE You are investigating the systematic risk for a stock portfolio. The data contains weekly excess returns (in percent)
can you please help me 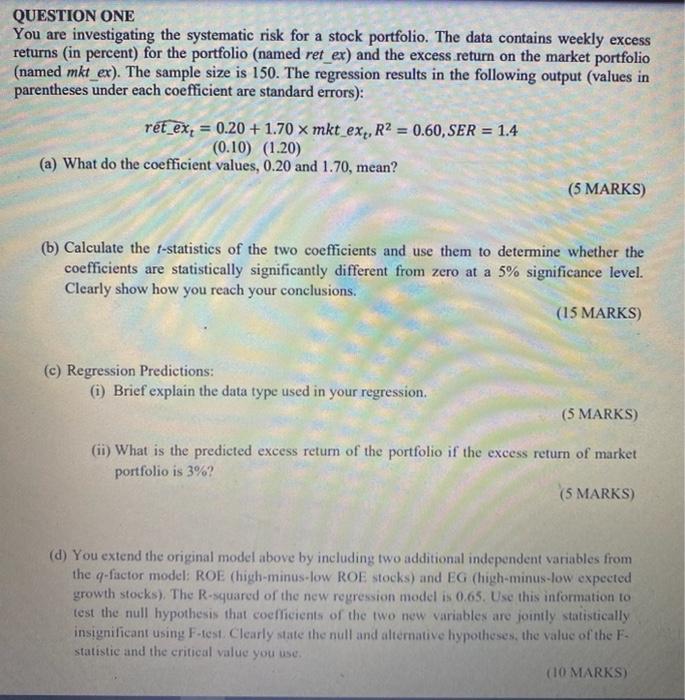
QUESTION ONE You are investigating the systematic risk for a stock portfolio. The data contains weekly excess returns (in percent) for the portfolio (named ret_ex) and the excess return on the market portfolio (named mkt_ex). The sample size is 150. The regression results in the following output (values in parentheses under each coefficient are standard errors): rt_ex, = 0.20 +1.70 x mkt_ex, R = 0.60,SER = 1.4 (0.10) (1.20) (a) What do the coefficient values, 0.20 and 1.70, mean? (5 MARKS) (b) Calculate the t-statistics of the two coefficients and use them to determine whether the coefficients are statistically significantly different from zero at a 5% significance level. Clearly show how you reach your conclusions. (15 MARKS) (c) Regression Predictions: (i) Brief explain the data type used in your regression. (5 MARKS) (ii) What is the predicted excess return of the portfolio if the excess return of market portfolio is 3%? (5 MARKS) (d) You extend the original model above by including two additional independent variables from the q-factor model: ROE (high-minus-low ROE stocks) and EG (high-minus-low expected growth stocks). The R-squared of the new regression model is 0.65. Use this information to test the null hypothesis that coefficients of the two new variables are jointly statistically insignificant using F-test. Clearly state the null and alternative hypotheses, the value of the F- statistic and the critical value you use. (10 MARKS) QUESTION ONE You are investigating the systematic risk for a stock portfolio. The data contains weekly excess returns (in percent) for the portfolio (named ret_ex) and the excess return on the market portfolio (named mkt_ex). The sample size is 150. The regression results in the following output (values in parentheses under each coefficient are standard errors): rt_ex, = 0.20 +1.70 x mkt_ex, R = 0.60,SER = 1.4 (0.10) (1.20) (a) What do the coefficient values, 0.20 and 1.70, mean? (5 MARKS) (b) Calculate the t-statistics of the two coefficients and use them to determine whether the coefficients are statistically significantly different from zero at a 5% significance level. Clearly show how you reach your conclusions. (15 MARKS) (c) Regression Predictions: (i) Brief explain the data type used in your regression. (5 MARKS) (ii) What is the predicted excess return of the portfolio if the excess return of market portfolio is 3%? (5 MARKS) (d) You extend the original model above by including two additional independent variables from the q-factor model: ROE (high-minus-low ROE stocks) and EG (high-minus-low expected growth stocks). The R-squared of the new regression model is 0.65. Use this information to test the null hypothesis that coefficients of the two new variables are jointly statistically insignificant using F-test. Clearly state the null and alternative hypotheses, the value of the F- statistic and the critical value you use. (10 MARKS) Step by Step Solution
There are 3 Steps involved in it
Step: 1

Get Instant Access to Expert-Tailored Solutions
See step-by-step solutions with expert insights and AI powered tools for academic success
Step: 2

Step: 3
Ace Your Homework with AI
Get the answers you need in no time with our AI-driven, step-by-step assistance
Get Started
Your Financial Well Being How To Get Your Financial Well Being With Smart Spending Habits
Authors: Fransisca Patten
1st Edition
979-8388729705