

Question
can you please help me solve the questions below, the data for the question has been attached, the table 1 and 2 data is graph
can you please help me solve the questions below, the data for the question has been attached, the table 1 and 2 data is graph and analysis, please can you help me plot a graph , for the data graph in the proteases experiment the variables plotted on each axis will be ( y-axis - absorbance, X-axis - time (sec) thank you
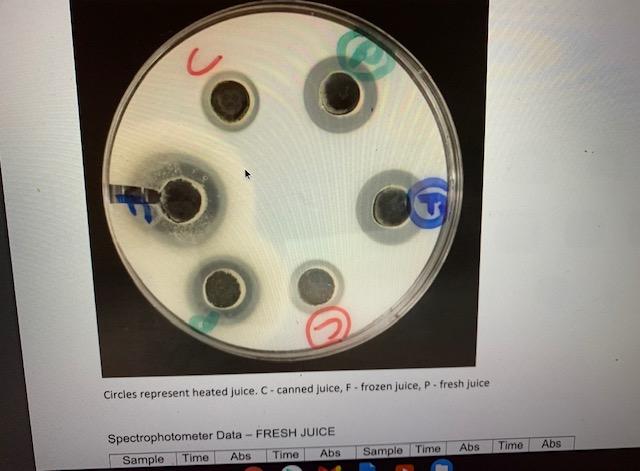
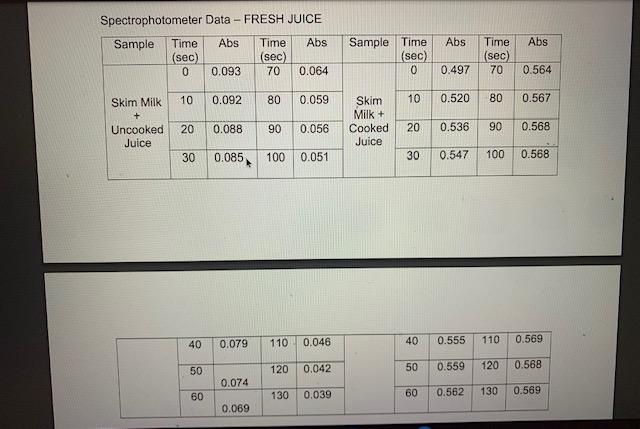
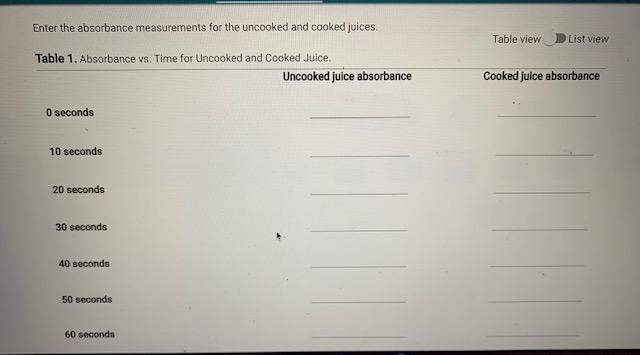
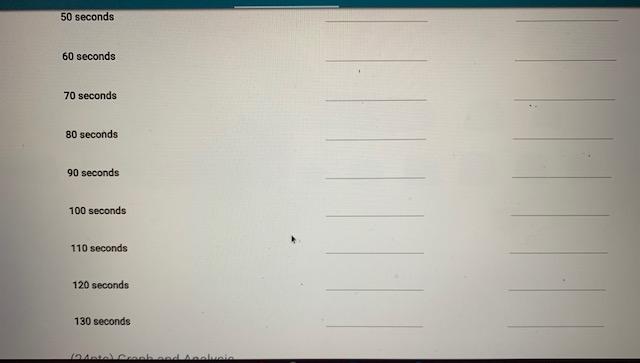
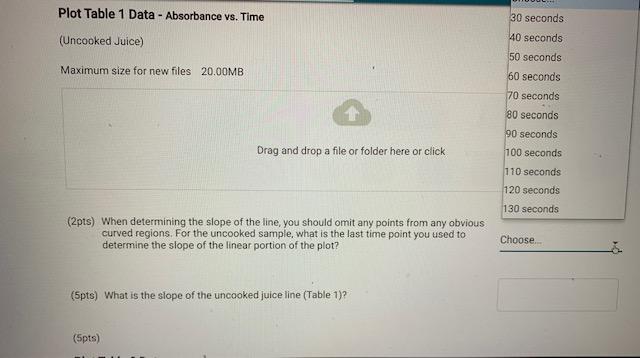
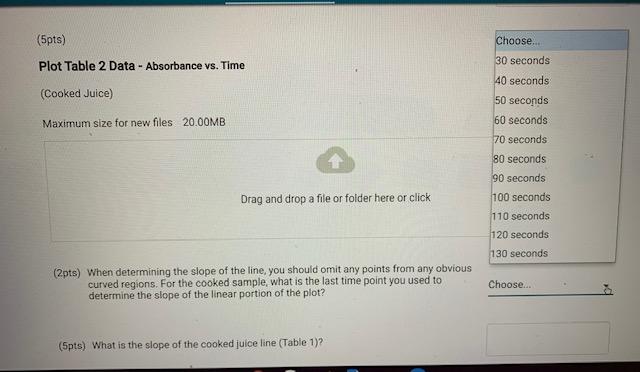
Circles represent heated juice. C-canned juice, F-frozen juice, P. fresh juice Spectrophotometer Data- FRESH JUICE Sample Time Abs Time Abs Abs Time Abs Sample Time Spectrophotometer Data - FRESH JUICE Sample Time Abs Time Abs (sec) (sec) 0 0.093 70 0.064 Abs Abs Sample Time (sec) 0 Time (sec) 70 0.497 0.564 10 Skim Milk 0.092 80 0.059 10 0.520 80 0.567 Skim Milk + Cooked Juice 20 0.088 90 0.056 20 0.536 90 0.568 Uncooked Juice 30 0.085 100 0.051 30 0.547 100 0.568 40 0.079 110 0.046 40 0.555 110 0.569 50 120 0.042 50 0.559 120 0.568 0.074 130 0.039 60 60 0.562 130 0.569 0.069 Enter the absorbance measurements for the uncooked and cooked juices Table view List View Table 1. Absorbance vs. Time for Uncooked and Cooked Juice Uncooked juice absorbance Cooked juice absorbance O seconds 10 seconds 20 seconds 30 seconds 40 seconds 50 seconds 60 seconds 50 seconds 60 seconds 70 seconds 80 seconds 90 seconds 100 seconds 110 seconds 120 seconds 130 seconds combi Plot Table 1 Data - Absorbance vs. Time 30 seconds (Uncooked Juice) Maximum size for new files 20.00MB 40 seconds 50 seconds 60 seconds 70 seconds 80 seconds 90 seconds Drag and drop a file or folder here or click 100 seconds 110 seconds 120 seconds 130 seconds (2pts) When determining the slope of the line, you should omit any points from any obvious curved regions. For the uncooked sample, what is the last time point you used to determine the slope of the linear portion of the plot? Choose (5pts) What is the slope of the uncooked juice line (Table 1)? (Spts) (5pts) Plot Table 2 Data - Absorbance vs. Time Choose. 30 seconds 40 seconds 50 seconds 60 seconds (Cooked Juice) Maximum size for new files 20.00MB 70 seconds 80 seconds 90 seconds Drag and drop a file or folder here or click 100 seconds 110 seconds 120 seconds 130 seconds (2pts) When determining the slope of the line, you should omit any points from any obvious curved regions. For the cooked sample, what is the last time point you used to determine the slope of the linear portion of the plot? Choose... (Spts) What is the slope of the cooked juice line (Table 1)? Circles represent heated juice. C-canned juice, F-frozen juice, P. fresh juice Spectrophotometer Data- FRESH JUICE Sample Time Abs Time Abs Abs Time Abs Sample Time Spectrophotometer Data - FRESH JUICE Sample Time Abs Time Abs (sec) (sec) 0 0.093 70 0.064 Abs Abs Sample Time (sec) 0 Time (sec) 70 0.497 0.564 10 Skim Milk 0.092 80 0.059 10 0.520 80 0.567 Skim Milk + Cooked Juice 20 0.088 90 0.056 20 0.536 90 0.568 Uncooked Juice 30 0.085 100 0.051 30 0.547 100 0.568 40 0.079 110 0.046 40 0.555 110 0.569 50 120 0.042 50 0.559 120 0.568 0.074 130 0.039 60 60 0.562 130 0.569 0.069 Enter the absorbance measurements for the uncooked and cooked juices Table view List View Table 1. Absorbance vs. Time for Uncooked and Cooked Juice Uncooked juice absorbance Cooked juice absorbance O seconds 10 seconds 20 seconds 30 seconds 40 seconds 50 seconds 60 seconds 50 seconds 60 seconds 70 seconds 80 seconds 90 seconds 100 seconds 110 seconds 120 seconds 130 seconds combi Plot Table 1 Data - Absorbance vs. Time 30 seconds (Uncooked Juice) Maximum size for new files 20.00MB 40 seconds 50 seconds 60 seconds 70 seconds 80 seconds 90 seconds Drag and drop a file or folder here or click 100 seconds 110 seconds 120 seconds 130 seconds (2pts) When determining the slope of the line, you should omit any points from any obvious curved regions. For the uncooked sample, what is the last time point you used to determine the slope of the linear portion of the plot? Choose (5pts) What is the slope of the uncooked juice line (Table 1)? (Spts) (5pts) Plot Table 2 Data - Absorbance vs. Time Choose. 30 seconds 40 seconds 50 seconds 60 seconds (Cooked Juice) Maximum size for new files 20.00MB 70 seconds 80 seconds 90 seconds Drag and drop a file or folder here or click 100 seconds 110 seconds 120 seconds 130 seconds (2pts) When determining the slope of the line, you should omit any points from any obvious curved regions. For the cooked sample, what is the last time point you used to determine the slope of the linear portion of the plot? Choose... (Spts) What is the slope of the cooked juice line (Table 1)Step by Step Solution
There are 3 Steps involved in it
Step: 1

Get Instant Access to Expert-Tailored Solutions
See step-by-step solutions with expert insights and AI powered tools for academic success
Step: 2

Step: 3
Ace Your Homework with AI
Get the answers you need in no time with our AI-driven, step-by-step assistance
Get Started
Financial Markets And Corporate Strategy
Authors: David Hillier , Mark Grinblatt , Sheridan Titman
2nd Edition
0077129423,0077141350