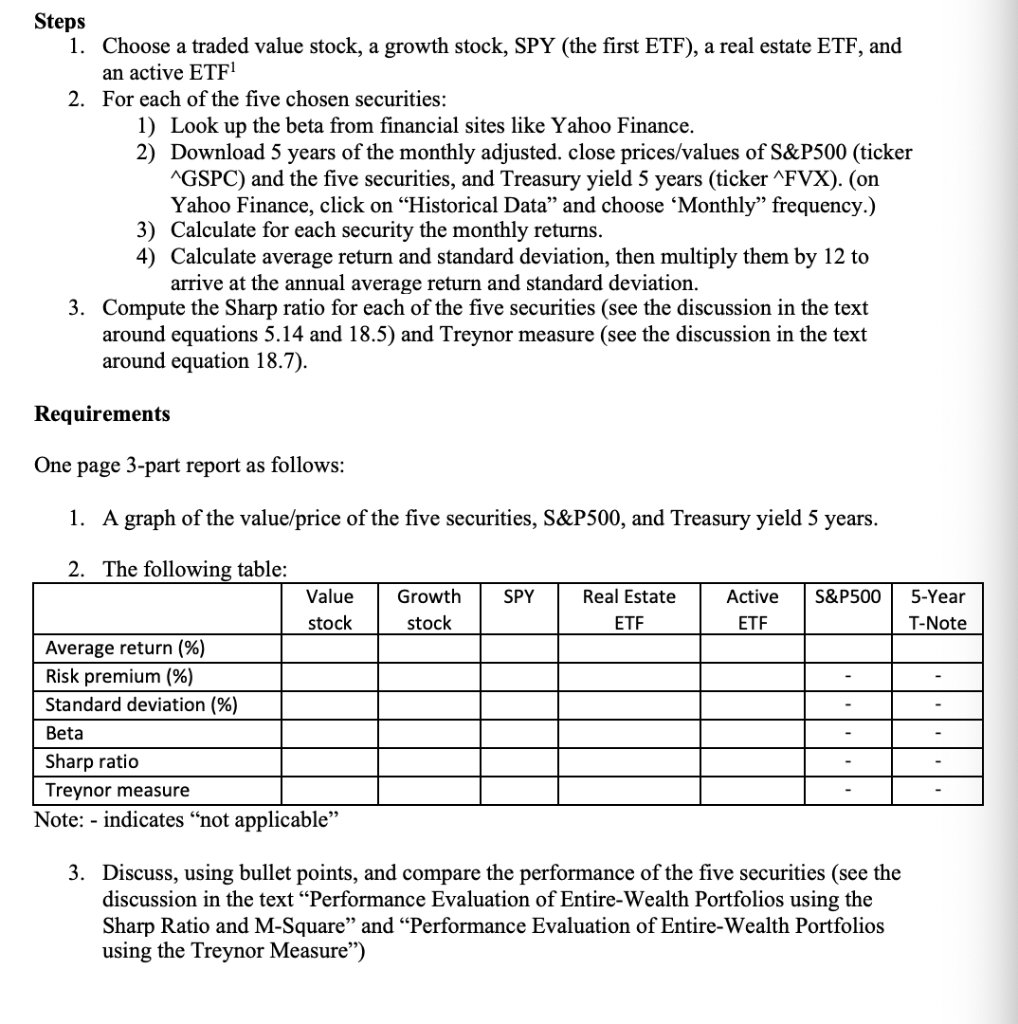
 Can you please help me with number 3?
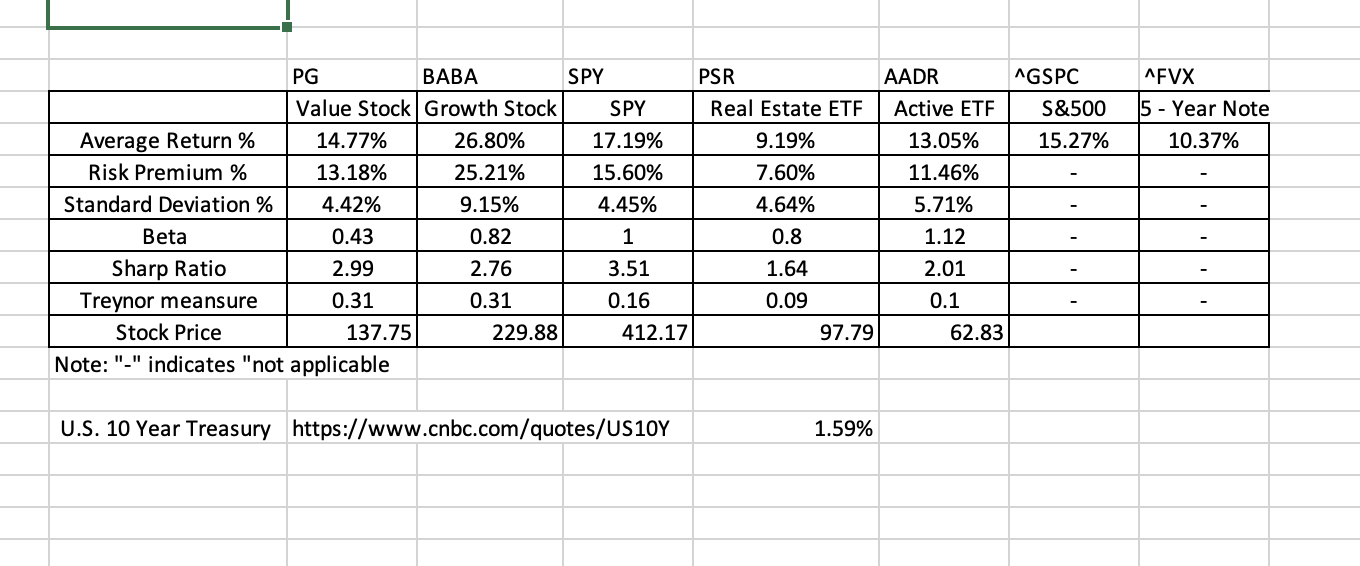
AFVX 15 - Year Note 10.37% PG BABA SPY PSR AADR AGSPC Value Stock Growth Stock SPY Real Estate ETF Active ETF S&500 Average Return % 14.77% 26.80% 17.19% 9.19% 13.05% 15.27% Risk Premium % 13.18% 25.21% 15.60% 7.60% 11.46% Standard Deviation % 4.42% 9.15% 4.45% 4.64% 5.71% Beta 0.43 0.82 1 0.8 1.12 Sharp Ratio 2.99 2.76 3.51 1.64 2.01 Treynor meansure 0.31 0.31 0.16 0.09 0.1 Stock Price 137.75 229.88 412.17 97.79 62.83 Note:"-" indicates "not applicable U.S. 10 Year Treasury https://www.cnbc.com/quotes/US10Y 1.59% Steps 1. Choose a traded value stock, a growth stock, SPY (the first ETF), a real estate ETF, and an active ETF 2. For each of the five chosen securities: 1) Look up the beta from financial sites like Yahoo Finance. 2) Download 5 years of the monthly adjusted. close prices/values of S&P500 (ticker ^GSPC) and the five securities, and Treasury yield 5 years (ticker ^FVX). (on Yahoo Finance, click on Historical Data and choose Monthly frequency.) 3) Calculate for each security the monthly returns. 4) Calculate average return and standard deviation, then multiply them by 12 to arrive at the annual average return and standard deviation. 3. Compute the Sharp ratio for each of the five securities (see the discussion in the text around equations 5.14 and 18.5) and Treynor measure (see the discussion in the text around equation 18.7). Requirements One page 3-part report as follows: 1. A graph of the value/price of the five securities, S&P500, and Treasury yield 5 years. SPY S&P500 Growth stock Real Estate ETF Active ETF 5-Year T-Note 2. The following table: Value stock Average return (%) Risk premium (%) Standard deviation (%) Beta Sharp ratio Treynor measure Note: - indicates not applicable 3. Discuss, using bullet points, and compare the per mance of the five securities (see the discussion in the text Performance Evaluation of Entire-Wealth Portfolios using the Sharp Ratio and M-Square and Performance Evaluation of Entire-Wealth Portfolios using the Treynor Measure) AFVX 15 - Year Note 10.37% PG BABA SPY PSR AADR AGSPC Value Stock Growth Stock SPY Real Estate ETF Active ETF S&500 Average Return % 14.77% 26.80% 17.19% 9.19% 13.05% 15.27% Risk Premium % 13.18% 25.21% 15.60% 7.60% 11.46% Standard Deviation % 4.42% 9.15% 4.45% 4.64% 5.71% Beta 0.43 0.82 1 0.8 1.12 Sharp Ratio 2.99 2.76 3.51 1.64 2.01 Treynor meansure 0.31 0.31 0.16 0.09 0.1 Stock Price 137.75 229.88 412.17 97.79 62.83 Note:"-" indicates "not applicable U.S. 10 Year Treasury https://www.cnbc.com/quotes/US10Y 1.59% Steps 1. Choose a traded value stock, a growth stock, SPY (the first ETF), a real estate ETF, and an active ETF 2. For each of the five chosen securities: 1) Look up the beta from financial sites like Yahoo Finance. 2) Download 5 years of the monthly adjusted. close prices/values of S&P500 (ticker ^GSPC) and the five securities, and Treasury yield 5 years (ticker ^FVX). (on Yahoo Finance, click on Historical Data and choose Monthly frequency.) 3) Calculate for each security the monthly returns. 4) Calculate average return and standard deviation, then multiply them by 12 to arrive at the annual average return and standard deviation. 3. Compute the Sharp ratio for each of the five securities (see the discussion in the text around equations 5.14 and 18.5) and Treynor measure (see the discussion in the text around equation 18.7). Requirements One page 3-part report as follows: 1. A graph of the value/price of the five securities, S&P500, and Treasury yield 5 years. SPY S&P500 Growth stock Real Estate ETF Active ETF 5-Year T-Note 2. The following table: Value stock Average return (%) Risk premium (%) Standard deviation (%) Beta Sharp ratio Treynor measure Note: - indicates not applicable 3. Discuss, using bullet points, and compare the per mance of the five securities (see the discussion in the text Performance Evaluation of Entire-Wealth Portfolios using the Sharp Ratio and M-Square and Performance Evaluation of Entire-Wealth Portfolios using the Treynor Measure)

 Can you please help me with number 3?


