can you please help me with this questions. it is in the attachment. they are screenshot.
Thank you
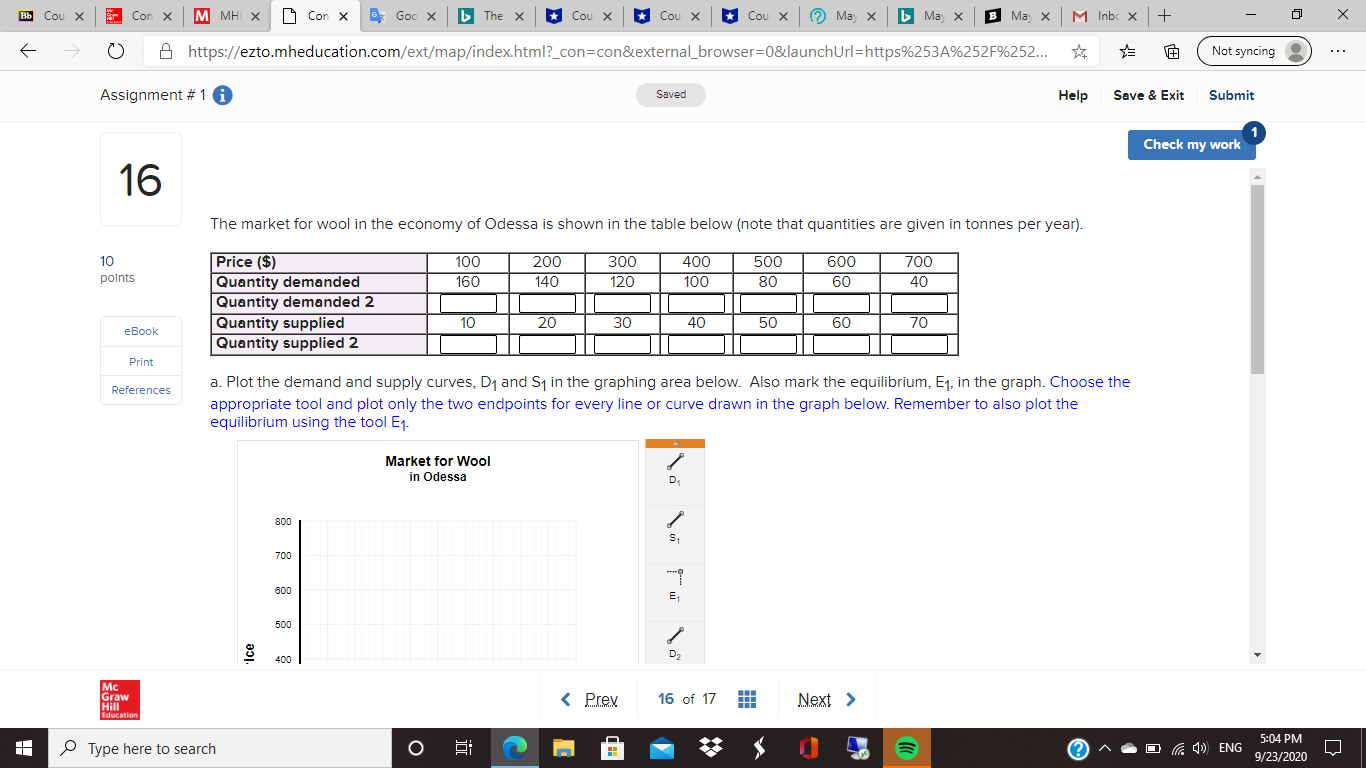
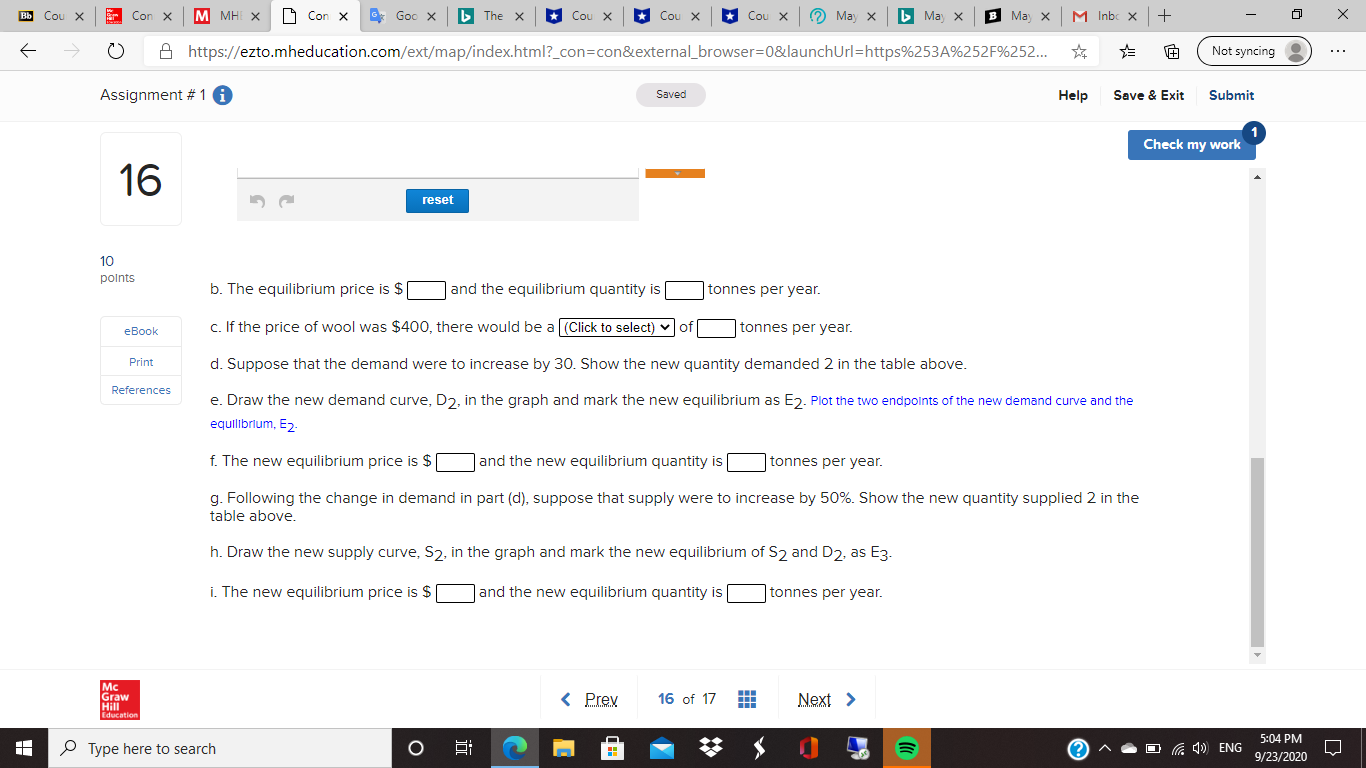
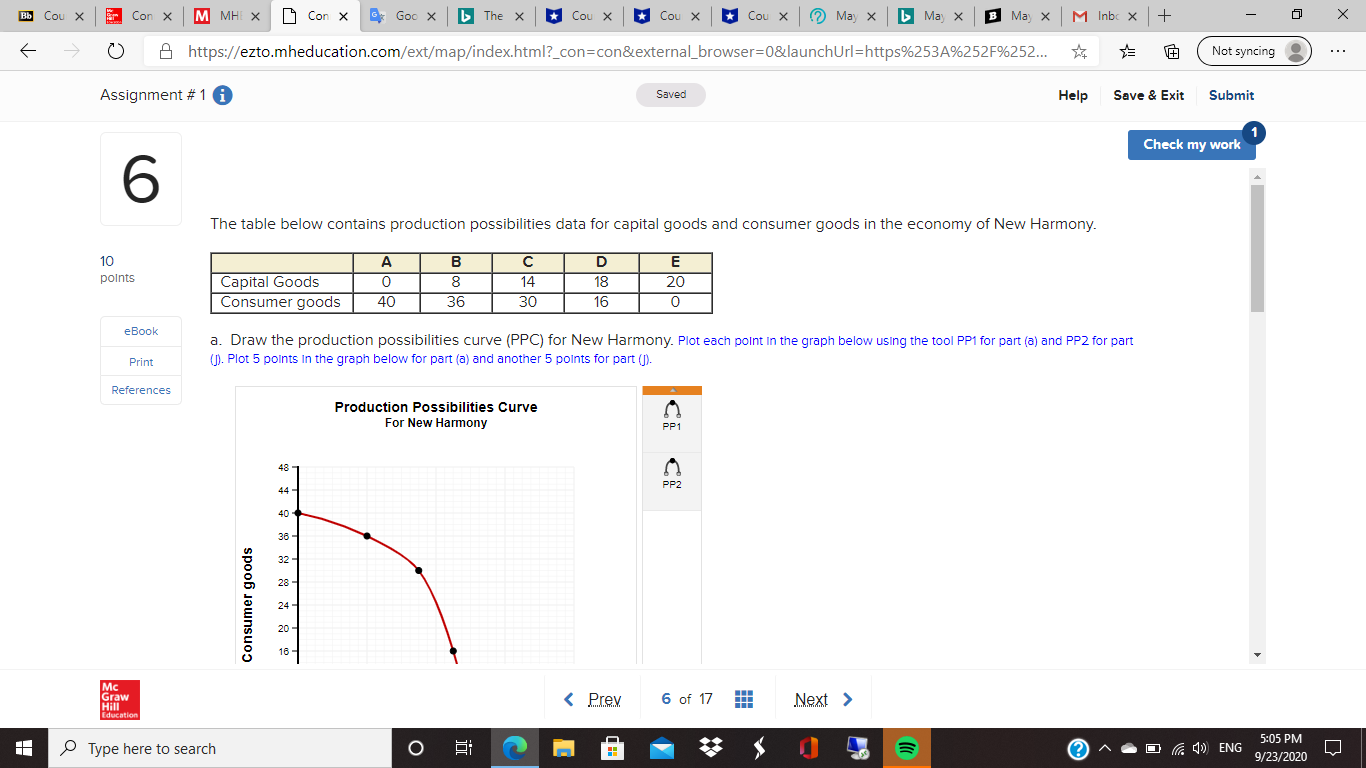
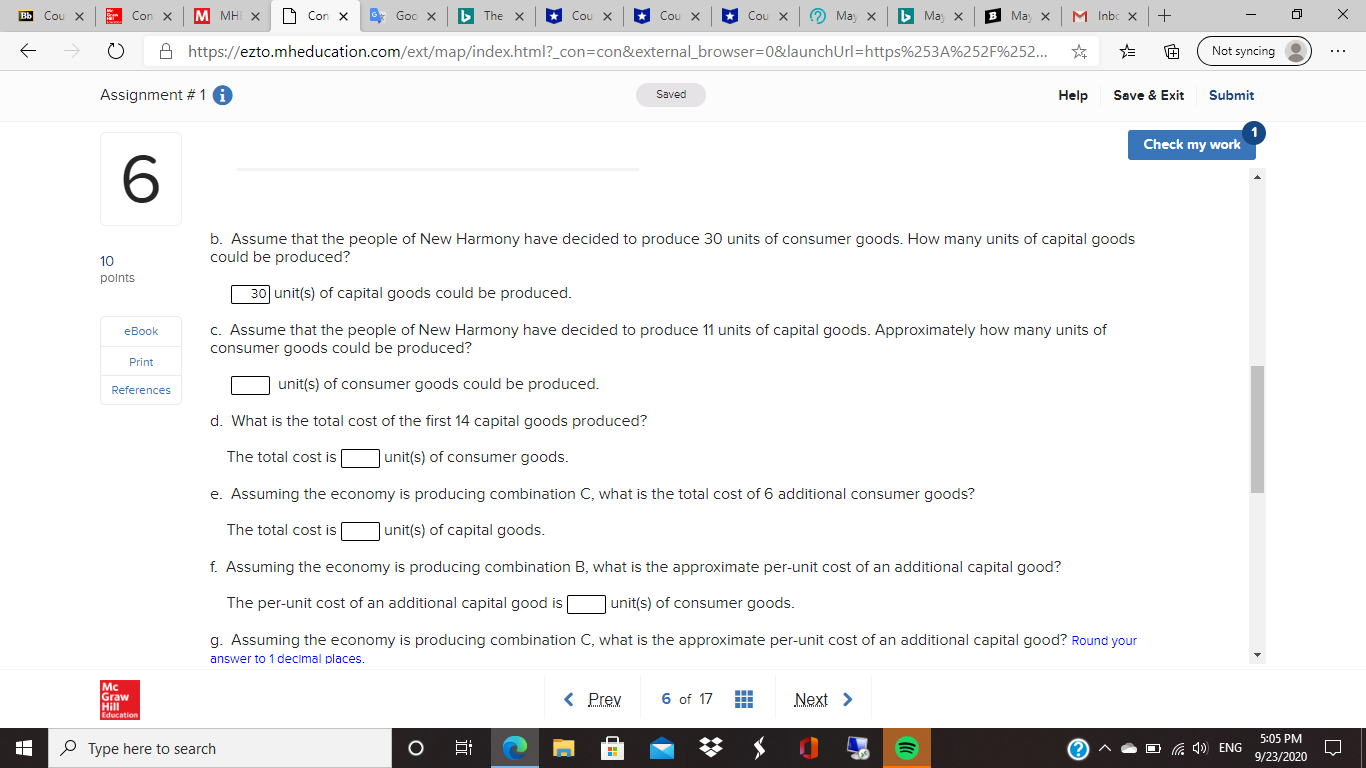
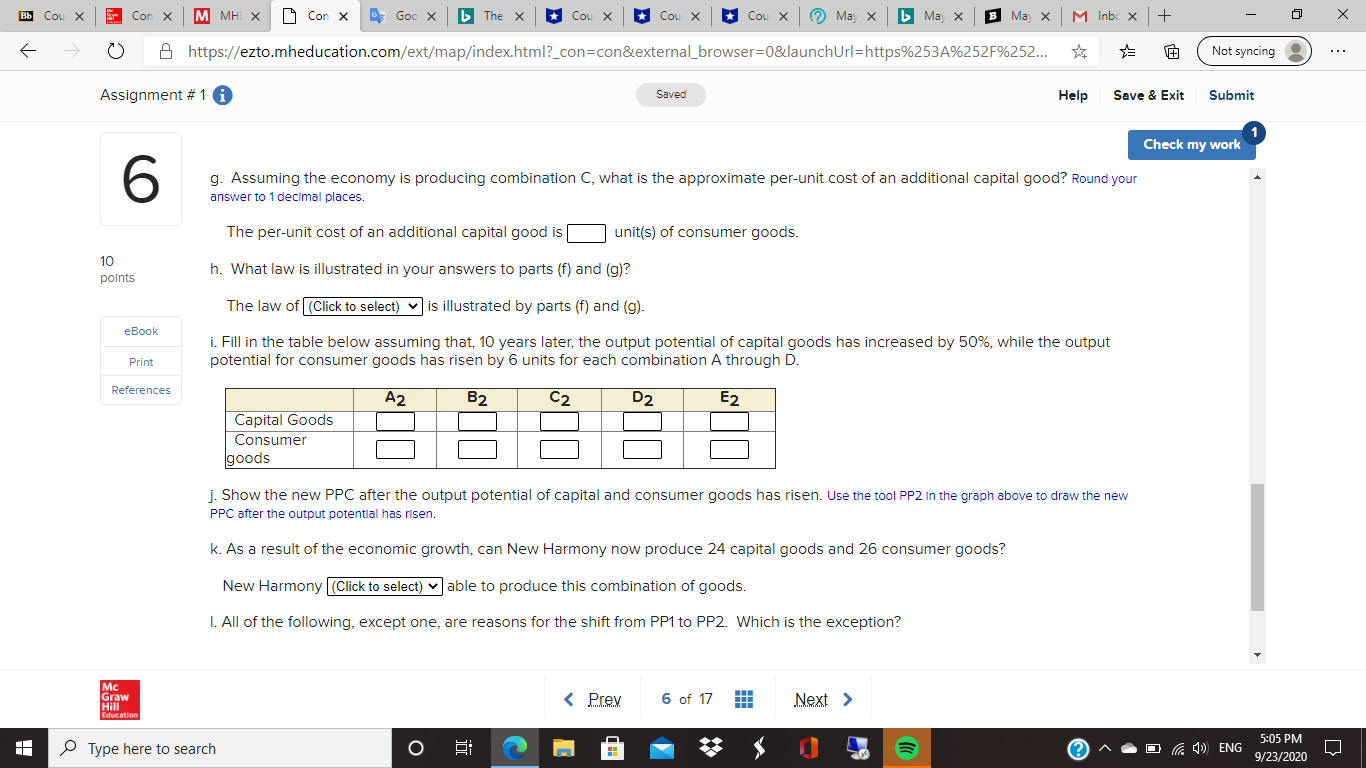
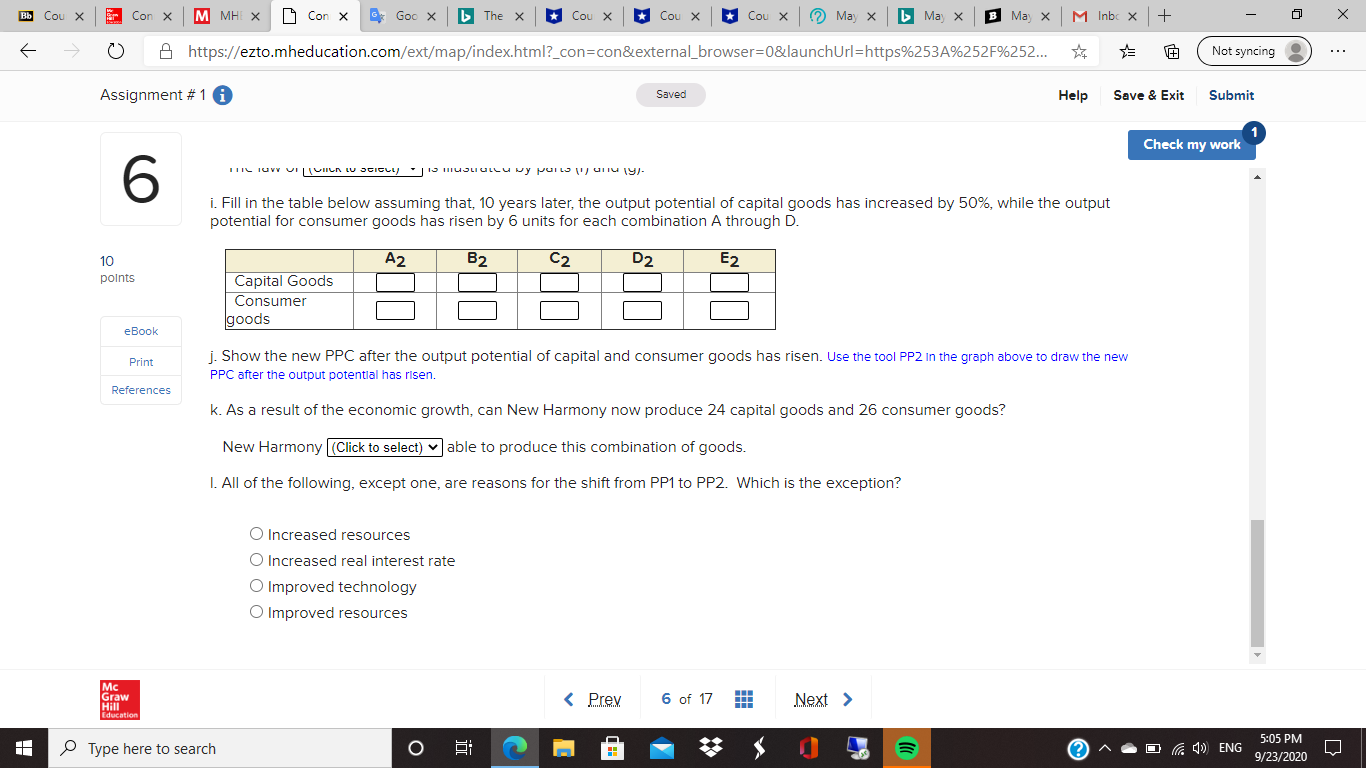
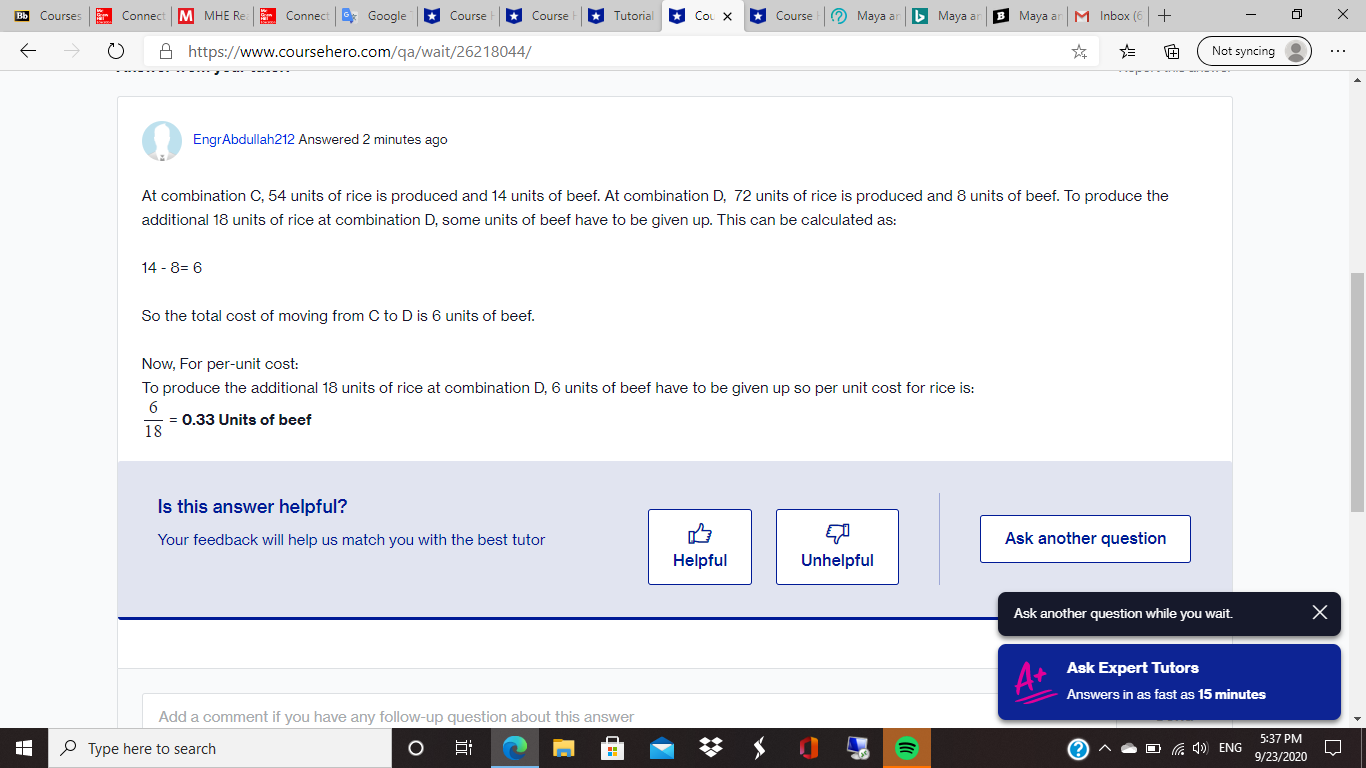
Bb Cou X Er Con X M MHI X Con X x Goo X b The X * Cou X Cou X * Cou X ?) May X May X B May X M Inbc x + X O https://ezto.mheducation.com/ext/map/index.html?_con=con&external_browser=0&launchUrl=https%253A%252F%252... Not syncing Assignment # 1 i Saved Help Save & Exit Submit Check my work 16 The market for wool in the economy of Odessa is shown in the table below (note that quantities are given in tonnes per year). 10 Price ($) 100 200 300 400 points 500 600 700 Quantity demanded 160 140 120 100 80 60 40 Quantity demanded 2 eBook Quantity supplied 10 20 30 40 50 60 70 Quantity supplied 2 Print References a. Plot the demand and supply curves, D1 and S1 in the graphing area below. Also mark the equilibrium, E1, in the graph. Choose the appropriate tool and plot only the two endpoints for every line or curve drawn in the graph below. Remember to also plot the equilibrium using the tool E1. Market for Wool in Odessa D , S 1 700 800 500 Ice 400 Mc Graw Hill Type here to search O 0 ?) ^ 6 0) ENG 5:04 PM 9/23/2020Bb Cou X Er Con X M MHI X Con X x Goo X b The X * Cou X Cou X * Cou X ?) May X May X B May X M Inbc x + X O https://ezto.mheducation.com/ext/map/index.html?_con=con&external_browser=0&launchUrl=https%253A%252F%252... Not syncing Assignment # 1 i Saved Help Save & Exit Submit Check my work 16 reset 10 points b. The equilibrium price is $ and the equilibrium quantity is tonnes per year. eBook c. If the price of wool was $400, there would be a |(Click to select) v | of tonnes per year. Print d. Suppose that the demand were to increase by 30. Show the new quantity demanded 2 in the table above. References e. Draw the new demand curve, D2, in the graph and mark the new equilibrium as E2. Plot the two endpoints of the new demand curve and the equilibrium, E2- f. The new equilibrium price is $ and the new equilibrium quantity is tonnes per year. g. Following the change in demand in part (d), suppose that supply were to increase by 50%. Show the new quantity supplied 2 in the table above. h. Draw the new supply curve, $2, in the graph and mark the new equilibrium of $2 and D2, as E3. i. The new equilibrium price is $ |and the new equilibrium quantity is tonnes per year. Mc Graw Hill 16 of 17 Next > Education Type here to search O ?) ^ 6 0 /ENG 5:05 PM 9/23/2020Bb Cou X Er Con X M MHI X Con X x Goo X b The X * Cou X Cou X * Cou X ?) May X May X B May X M Inbc x + X O https://ezto.mheducation.com/ext/map/index.html?_con=con&external_browser=0&launchUrl=https%253A%252F%252... Not syncing Assignment # 1 i Saved Help Save & Exit Submit Check my work 6 b. Assume that the people of New Harmony have decided to produce 30 units of consumer goods. How many units of capital goods 10 could be produced? points 30 unit(s) of capital goods could be produced. eBook c. Assume that the people of New Harmony have decided to produce 11 units of capital goods. Approximately how many units of consumer goods could be produced? Print References unit(s) of consumer goods could be produced. d. What is the total cost of the first 14 capital goods produced? The total cost is |unit(s) of consumer goods. e. Assuming the economy is producing combination C, what is the total cost of 6 additional consumer goods? The total cost is | unit(s) of capital goods. f. Assuming the economy is producing combination B, what is the approximate per-unit cost of an additional capital good? The per-unit cost of an additional capital good is unit(s) of consumer goods. g. Assuming the economy is producing combination C, what is the approximate per-unit cost of an additional capital good? Round your answer to 1 decimal places. Mc Graw Hill ducation Type here to search O O ?) A GO ()ENG 5:05 PM 9/23/2020Bb Cou X Er Con X M MHI X Con X Goo X b The X * Cou X Cou X * Cou X ?) May X May X B May X M Inbc x + X O https://ezto.mheducation.com/ext/map/index.html?_con=con&external_browser=0&launchUrl=https%253A%252F%252... Not syncing Assignment # 1 i Saved Help Save & Exit Submit Check my work 6 g. Assuming the economy is producing combination C, what is the approximate per-unit cost of an additional capital good? Round your answer to 1 decimal places. The per-unit cost of an additional capital good is unit(s) of consumer goods. 10 points h. What law is illustrated in your answers to parts (f) and (g)? The law of (Click to select) | is illustrated by parts (f) and (9). eBook i. Fill in the table below assuming that, 10 years later, the output potential of capital goods has increased by 50%, while the output Print potential for consumer goods has risen by 6 units for each combination A through D. References A2 B2 C2 D2 E2 Capital Goods Consumer goods j. Show the new PPC after the output potential of capital and consumer goods has risen. Use the tool PP2 in the graph above to draw the new PPC after the output potential has risen. k. As a result of the economic growth, can New Harmony now produce 24 capital goods and 26 consumer goods? New Harmony |(Click to select) | able to produce this combination of goods. I. All of the following, except one, are reasons for the shift from PP1 to PP2. Which is the exception? Mc Graw Hill 6 of 17 Education Type here to search O E ?) ^ 6 0 7ENG 5:05 PM 9/23/2020Bb Cou X Er Con X M MHI X Con X Goo X b The X * Cou X Cou X * Cou X ?) May X May X B May X M Inbc x + X O https://ezto.mheducation.com/ext/map/index.html?_con=con&external_browser=0&launchUrl=https%253A%252F%252... Not syncing Assignment # 1 i Saved Help Save & Exit Submit Check my work 6 i. Fill in the table below assuming that, 10 years later, the output potential of capital goods has increased by 50%, while the output potential for consumer goods has risen by 6 units for each combination A through D. 10 A2 B2 C2 D2 E2 points Capital Goods Consumer eBook goods Print j. Show the new PPC after the output potential of capital and consumer goods has risen. Use the tool PP2 in the graph above to draw the new PPC after the output potential has risen. References k. As a result of the economic growth, can New Harmony now produce 24 capital goods and 26 consumer goods? New Harmony |(Click to select) | able to produce this combination of goods. I. All of the following, except one, are reasons for the shift from PP1 to PP2. Which is the exception? O Increased resources O Increased real interest rate O Improved technology O Improved resources Mc Graw Hill Education Type here to search O ?) ^ 6 0 /ENG 5:05 PM 9/23/2020Bb Courses ar Connect M MHE Rez Er Connect Google * Course * Course * Tutorial * Cou X * Course + 2) Maya an b Maya an B Maya an M Inbox (6 + X O 8 https://www.coursehero.com/qa/wait/26218044/ Not syncing EngrAbdullah212 Answered 2 minutes ago At combination C, 54 units of rice is produced and 14 units of beef. At combination D, 72 units of rice is produced and 8 units of beef. To produce the additional 18 units of rice at combination D, some units of beef have to be given up. This can be calculated as: 14 - 8=6 So the total cost of moving from C to D is 6 units of beef. Now, For per-unit cost: To produce the additional 18 units of rice at combination D, 6 units of beef have to be given up so per unit cost for rice is: 6 18 - = 0.33 Units of beef Is this answer helpful? Your feedback will help us match you with the best tutor Ask another question Helpful Unhelpful Ask another question while you wait. X 4+ Ask Expert Tutors Answers in as fast as 15 minutes Add a comment if you have any follow-up question about this answer Type here to search O ? A GO )ENG 5:37 PM 9/23/2020
