Can You please paraphrase this for me? Thanks!
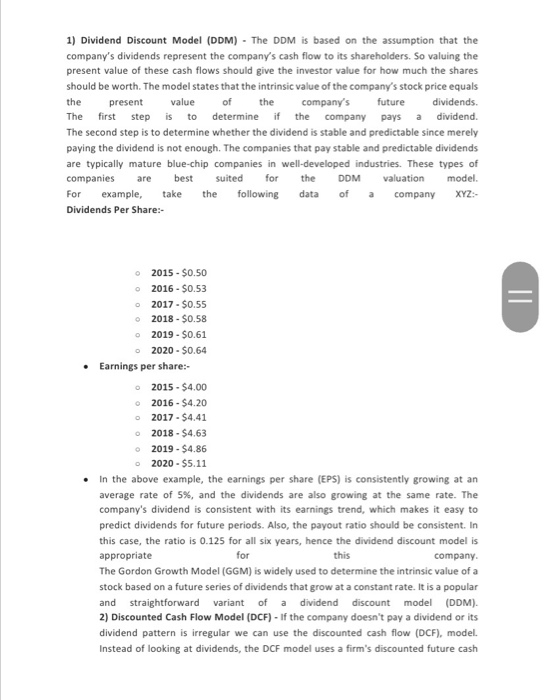
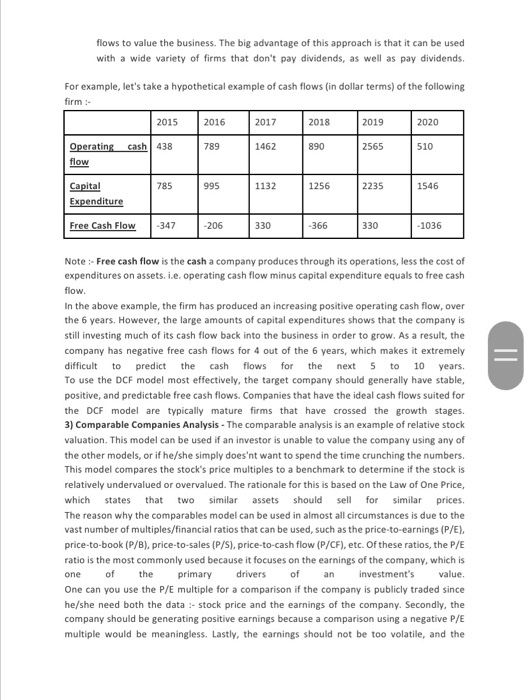
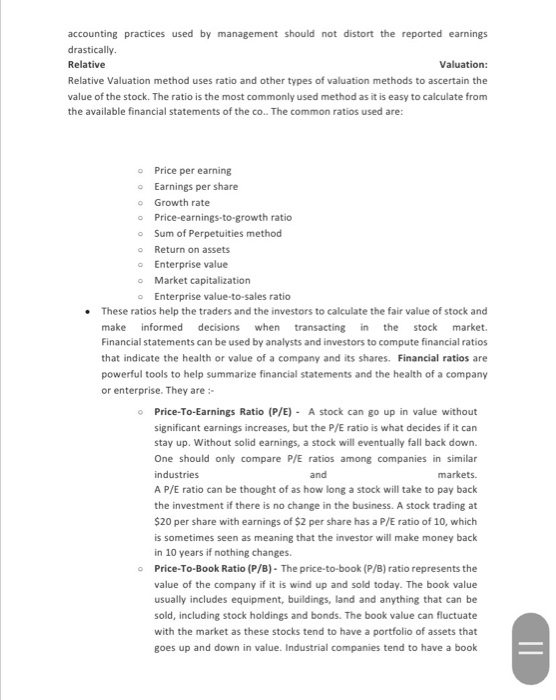
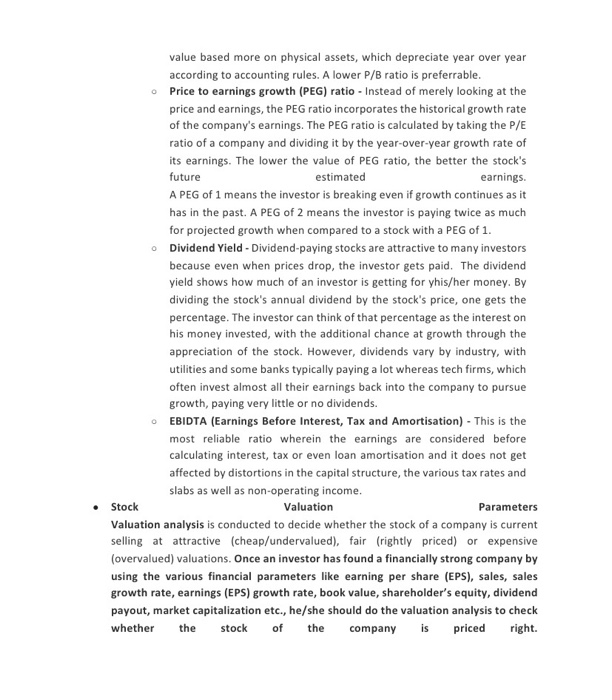
or current Stock Valuation While it comes to investing, picking the right stock plays a crucial role. Careful research and patience are needed. One needs to check several aspects of the company before investing. There are some essential parameters that have to be analyzed and compared with similar companies before picking a stock Stock valuation is an important tool that can help an investor make informed decisions about trading. It is a technique that determines the value of a company's stock by using standard formulas. It values the fair market value of a financial instrument at a particular time. The reason for stock valuation is to predict the future price or potential market prices for the investors to time their sales or purchase of investments. The stock valuation fundamentals aim to value the "Intrinsic" value of the stock that shows the profitability of the business and its future market value. The importance of valuing stocks is that the intrinsic value of a stock is not attached to its current price. By knowing a stock's intrinsic value, an investor may determine whether the stock is over- under-valued at its market price. Investors get a large amount of information about a company that can be potentially used in valuing its stocks from the available sources like the company's financial statements, newspapers, economic reports, stock reports, etc. However, an investor needs to be able to filter the relevant information from the wide array of data. Additionally, an investor should know about major stock valuation methods and the scenarios in which such methods are applicable. Stock valuation methods There are several methods for valuing a company or its stock, each with its own strengths and weaknesses. There's no one method that's best suited for every situation. Each stock is different, and each industry or sector has unique characteristics that may require multiple valuation methods. Some models try to find a company's intrinsic value based on its own financial statements and projects, while others use relative valuation against competitors/peers. For companies that pay dividends, a discount model like the Gordon growth model is often simple and reliable - but many companies do not pay dividends. A multiples approach may be employed to make comparative evaluations of a company's value in the market against its competitors or the broader market. When choosing a valuation method, the investor needs to ensure that the particular method is appropriate for the firm under consideration Stock valuation methods can be primarily categorized into two main types: absolute and relative. Absolute stock valuation is based upon the company's fundamental information. The method generally involves the analysis of various financial information that can be derived from a company's financial statements. Many techniques of absolute stock valuation primarily investigate the company's cash flows, dividends, and growth rates. Notable absolute stock valuation methods are dividend discount model (DDM) and the discounted cash flow model (DCF). 1) Dividend Discount Model (DDM) - The DDM is based on the assumption that the company's dividends represent the company's cash flow to its shareholders. So valuing the present value of these cash flows should give the investor value for how much the shares should be worth. The model states that the intrinsic value of the company's stock price equals the present value of the company's future dividends. The first step is to determine if the company pays a dividend. The second step is to determine whether the dividend is stable and predictable since merely paying the dividend is not enough. The companies that pay stable and predictable dividends are typically mature blue-chip companies in well-developed industries. These types of companies are best suited for the DDM valuation model. For example, take following data of company Dividends Per Share: the XYZ - II o 2015 - $0.50 2016 - $0.53 2017. $0.55 2018 - $0.58 2019 - $0.61 2020 - $0.64 Earnings per share: 2015 - $4.00 2016 - $4.20 2017. $4.41 2018 - $4.63 2019 - $4.86 2020 - $5.11 In the above example, the earnings per share (EPS) is consistently growing at an average rate of 5%, and the dividends are also growing at the same rate. The company's dividend is consistent with its earnings trend, which makes it easy to predict dividends for future periods. Also, the payout ratio should be consistent. In this case, the ratio is 0.125 for all six years, hence the dividend discount model is appropriate for this company. The Gordon Growth Model (GGM) is widely used to determine the intrinsic value of a stock based on a future series of dividends that grow at a constant rate. It is a popular and straightforward variant of a dividend discount model (DDM). 2) Discounted Cash Flow Model (DCF) - If the company doesn't pay a dividend or its dividend pattern is irregular we can use the discounted cash flow (DCF), model. Instead of looking at dividends, the DCF model uses a firm's discounted future cash flows to value the business. The big advantage of this approach is that it can be used with a wide variety of firms that don't pay dividends, as well as pay dividends. For example, let's take a hypothetical example of cash flows (in dollar terms) of the following firm - 2015 2016 2017 2018 2019 2020 cash 438 789 1462 890 2565 510 Operating flow 785 995 1132 1256 2235 1546 Capital Expenditure Free Cash Flow -347 -206 330 -366 330 -1036 = Note :- Free cash flow is the cash a company produces through its operations, less the cost of expenditures on assets. i.e. operating cash flow minus capital expenditure equals to free cash flow. In the above example, the firm has produced an increasing positive operating cash flow, over the 6 years. However, the large amounts of capital expenditures shows that the company is still investing much of its cash flow back into the business in order to grow. As a result, the company has negative free cash flows for 4 out of the 6 years, which makes it extremely difficult to predict the cash flows for the next 5 to 10 years. To use the DCF model most effectively, the target company should generally have stable, positive, and predictable free cash flows. Companies that have the ideal cash flows suited for the DCF model are typically mature firms that have crossed the growth stages. 3) Comparable Companies Analysis - The comparable analysis is an example of relative stock valuation. This model can be used if an investor is unable to value the company using any of the other models, or if he/she simply does'nt want to spend the time crunching the numbers. This model compares the stock's price multiples to a benchmark to determine if the stock is relatively undervalued or overvalued. The rationale for this is based on the Law of One Price, which states that two similar assets should sell for similar prices. The reason why the comparables model can be used in almost all circumstances is due to the vast number of multiples/financial ratios that can be used, such as the price-to-earnings (P/E), price-to-book (P/B), price-to-sales (P/S), price-to-cash flow (P/CF), etc. Of these ratios, the P/E ratio is the most commonly used because it focuses on the earnings of the company, which is one the primary drivers of an investment's value. One can you use the P/E multiple for a comparison if the company is publicly traded since he/she need both the data :- stock price and the earnings of the company. Secondly, the company should be generating positive earnings because a comparison using a negative P/E multiple would be meaningless. Lastly, the earnings should not be too volatile, and the of accounting practices used by management should not distort the reported earnings drastically. Relative Valuation: Relative Valuation method uses ratio and other types of valuation methods to ascertain the value of the stock. The ratio is the most commonly used method as it is easy to calculate from the available financial statements of the co.. The common ratios used are: Price per earning Earnings per share Growth rate Price-earnings-to-growth ratio Sum of Perpetuities method Return on assets Enterprise value Market capitalization Enterprise value-to-sales ratio These ratios help the traders and the investors to calculate the fair value of stock and make informed decisions when transacting in the stock market. Financial statements can be used by analysts and investors to compute financial ratios that indicate the health or value of a company and its shares. Financial ratios are powerful tools to help summarize financial statements and the health of a company or enterprise. They are : Price-To-Earnings Ratio (P/E) - A stock can go up in value without significant earnings increases, but the P/E ratio is what decides if it can stay up. Without solid earnings, a stock will eventually fall back down. One should only compare P/E ratios among companies in similar industries and markets. A P/E ratio can be thought of as how long a stock will take to pay back the investment if there is no change in the business. A stock trading at $20 per share with earnings of $2 per share has a P/E ratio of 10, which is sometimes seen as meaning that the investor will make money back in 10 years if nothing changes. Price-To-Book Ratio (P/B) - The price-to-book (P/B) ratio represents the value of the company if it is wind up and sold today. The book value usually includes equipment, buildings, land and anything that can be sold, including stock holdings and bonds. The book value can fluctuate with the market as these stocks tend to have a portfolio of assets that goes up and down in value. Industrial companies tend to have a book II value based more on physical assets, which depreciate year over year according to accounting rules. A lower P/B ratio is preferrable. Price to earnings growth (PEG) ratio - Instead of merely looking at the price and earnings, the PEG ratio incorporates the historical growth rate of the company's earnings. The PEG ratio is calculated by taking the P/E ratio of a company and dividing it by the year-over-year growth rate of its earnings. The lower the value of PEG ratio, the better the stock's future estimated earnings. A PEG of 1 means the investor is breaking even if growth continues as it has in the past. A PEG of 2 means the investor is paying twice as much for projected growth when compared to a stock with a PEG of 1. Dividend Yield - Dividend-paying stocks are attractive to many investors because even when prices drop, the investor gets paid. The dividend yield shows how much of an investor is getting for yhis/her money. By dividing the stock's annual dividend by the stock's price, one gets the percentage. The investor can think of that percentage as the interest on his money invested, with the additional chance at growth through the appreciation of the stock. However, dividends vary by industry, with utilities and some banks typically paying a lot whereas tech firms, which often invest almost all their earnings back into the company to pursue growth, paying very little or no dividends. EBIDTA (Earnings Before Interest, Tax and Amortisation) - This is the most reliable ratio wherein the earnings are considered before calculating interest, tax or even loan amortisation and it does not get affected by distortions in the capital structure, the various tax rates and slabs as well as non-operating income. Stock Valuation Parameters Valuation analysis is conducted to decide whether the stock of a company is current selling at attractive (cheap/undervalued), fair (rightly priced) or expensive (overvalued) valuations. Once an investor has found a financially strong company by using the various financial parameters like earning per share (EPS), sales, sales growth rate, earnings (EPS) growth rate, book value, shareholder's equity, dividend payout, market capitalization etc., he/she should do the valuation analysis to check whether the stock the company is priced right. of


