Can you please provide formula which i have to use in excel to calculate it.(or the way of solving it)
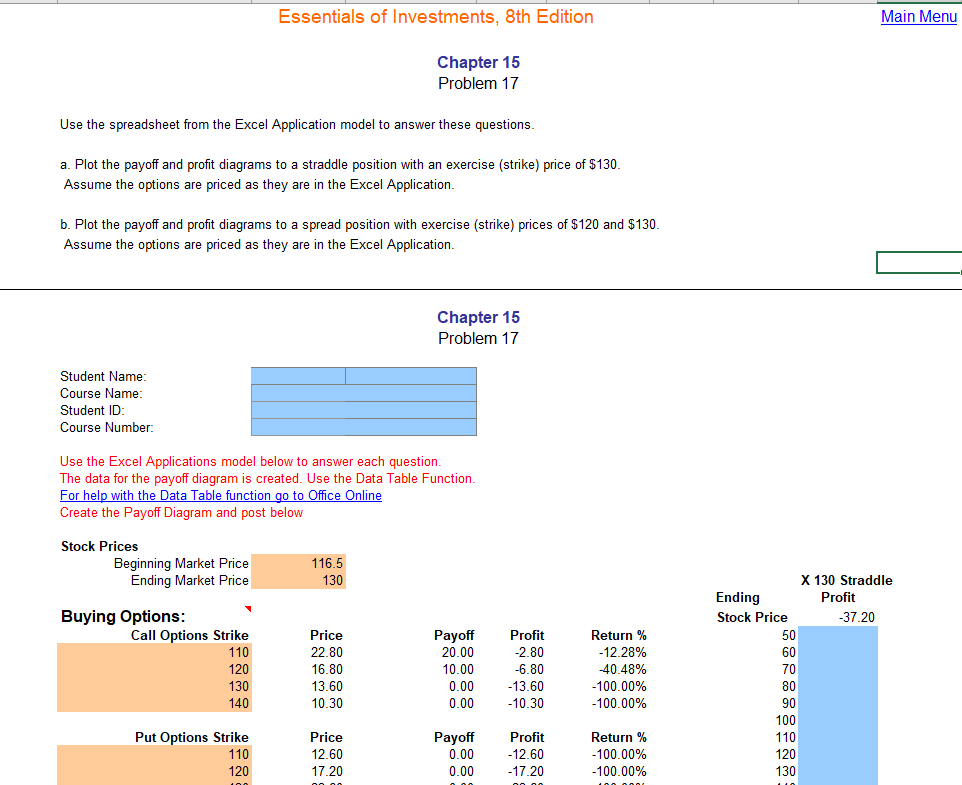
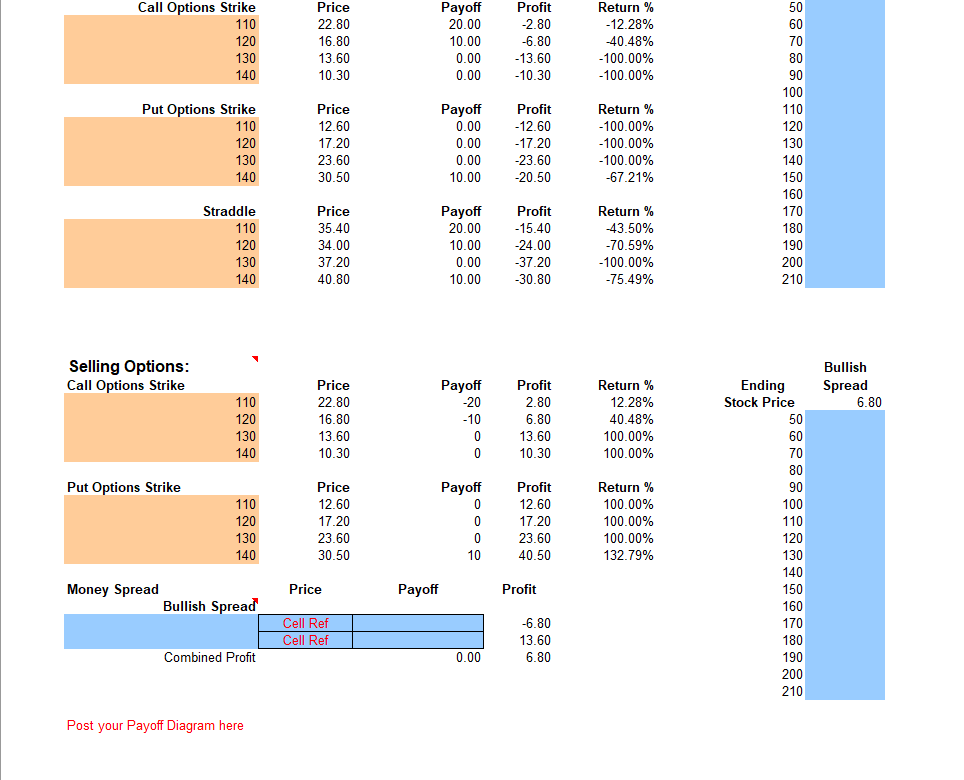
Essentials of Investments, 8th Edition Main Menu Chapter 15 Problem 17 Use the spreadsheet from the Excel Application model to answer these questions. a. Plot the payoff and profit diagrams to a straddle position with an exercise (strike) price of $130. Assume the options are priced as they are in the Excel Application. b. Plot the payoff and profit diagrams to a spread position with exercise (strike) prices of $120 and $130. Assume the options are priced as they are in the Excel Application. Chapter 15 Problem 17 Student Name: Course Name: Student ID Course Number: Use the Excel Applications model below to answer each question. The data for the payoff diagram is created. Use the Data Table Function. For help with the Data Table function go to Office Online Create the Payoff Diagram and post below Stock Prices Beginning Market Price Ending Market Price 116.5 130 Buying Options: Call Options Strike 110 120 130 140 Price 22.80 16.80 13.60 10.30 Payoff 20.00 10.00 0.00 0.00 Profit -2.80 -6.80 -13.60 -10.30 Return % - 12.28% -40.48% - 100.00% -100.00% X 130 Straddle Ending Profit Stock Price -37.20 50 60 70 80 90 100 110 120 130 Put Options Strike 110 120 Price 12.60 17.20 Payoff 0.00 0.00 Profit -12.60 -17.20 Return % -100.00% -100.00% Call Options Strike 110 120 130 140 Price 22.80 16.80 13.60 10.30 Payoff 20.00 10.00 0.00 0.00 Profit -2.80 -6.80 -13.60 -10.30 Return % - 12.28% -40.48% - 100.00% -100.00% Put Options Strike 110 120 130 140 Price 12.60 17.20 Payoff 0.00 0.00 0.00 10.00 Profit -12.60 -17.20 -23.60 -20.50 Return % -100.00% -100.00% -100.00% -67.21% 50 60 70 80 90 100 110 120 130 140 150 160 170 180 190 200 210 23.60 30.50 Straddle 110 120 130 140 Price 35.40 34.00 37.20 40.80 Payoff 20.00 10.00 0.00 10.00 Profit -15.40 -24.00 -37.20 -30.80 Return % -43.50% -70.59% -100.00% -75.49% Selling Options: Call Options Strike Bullish Spread 6.80 110 120 130 140 Price 22.80 16.80 13.60 10.30 Payoff -20 -10 0 0 Profit 2.80 6.80 13.60 10.30 Return % 12.28% 40.48% 100.00% 100.00% Put Options Strike 110 120 130 140 Price 12.60 17.20 23.60 30.50 Payoff 0 0 0 10 Profit 12.60 17.20 23.60 40.50 Return % 100.00% 100.00% 100.00% 132.79% Ending Stock Price 50 60 70 80 90 100 110 120 130 140 150 160 170 180 190 200 210 Price Payoff Profit Money Spread Bullish Spread Cell Ref Cell Ref -6.80 13.60 6.80 Combined Profit 0.00 Post your Payoff Diagram here Essentials of Investments, 8th Edition Main Menu Chapter 15 Problem 17 Use the spreadsheet from the Excel Application model to answer these questions. a. Plot the payoff and profit diagrams to a straddle position with an exercise (strike) price of $130. Assume the options are priced as they are in the Excel Application. b. Plot the payoff and profit diagrams to a spread position with exercise (strike) prices of $120 and $130. Assume the options are priced as they are in the Excel Application. Chapter 15 Problem 17 Student Name: Course Name: Student ID Course Number: Use the Excel Applications model below to answer each question. The data for the payoff diagram is created. Use the Data Table Function. For help with the Data Table function go to Office Online Create the Payoff Diagram and post below Stock Prices Beginning Market Price Ending Market Price 116.5 130 Buying Options: Call Options Strike 110 120 130 140 Price 22.80 16.80 13.60 10.30 Payoff 20.00 10.00 0.00 0.00 Profit -2.80 -6.80 -13.60 -10.30 Return % - 12.28% -40.48% - 100.00% -100.00% X 130 Straddle Ending Profit Stock Price -37.20 50 60 70 80 90 100 110 120 130 Put Options Strike 110 120 Price 12.60 17.20 Payoff 0.00 0.00 Profit -12.60 -17.20 Return % -100.00% -100.00% Call Options Strike 110 120 130 140 Price 22.80 16.80 13.60 10.30 Payoff 20.00 10.00 0.00 0.00 Profit -2.80 -6.80 -13.60 -10.30 Return % - 12.28% -40.48% - 100.00% -100.00% Put Options Strike 110 120 130 140 Price 12.60 17.20 Payoff 0.00 0.00 0.00 10.00 Profit -12.60 -17.20 -23.60 -20.50 Return % -100.00% -100.00% -100.00% -67.21% 50 60 70 80 90 100 110 120 130 140 150 160 170 180 190 200 210 23.60 30.50 Straddle 110 120 130 140 Price 35.40 34.00 37.20 40.80 Payoff 20.00 10.00 0.00 10.00 Profit -15.40 -24.00 -37.20 -30.80 Return % -43.50% -70.59% -100.00% -75.49% Selling Options: Call Options Strike Bullish Spread 6.80 110 120 130 140 Price 22.80 16.80 13.60 10.30 Payoff -20 -10 0 0 Profit 2.80 6.80 13.60 10.30 Return % 12.28% 40.48% 100.00% 100.00% Put Options Strike 110 120 130 140 Price 12.60 17.20 23.60 30.50 Payoff 0 0 0 10 Profit 12.60 17.20 23.60 40.50 Return % 100.00% 100.00% 100.00% 132.79% Ending Stock Price 50 60 70 80 90 100 110 120 130 140 150 160 170 180 190 200 210 Price Payoff Profit Money Spread Bullish Spread Cell Ref Cell Ref -6.80 13.60 6.80 Combined Profit 0.00 Post your Payoff Diagram here