

Answered step by step
Verified Expert Solution
Question
1 Approved Answer
can you please show me the block diagram and the graph from matlab for question 3? there are 3 questions: 5.20 , 6.12 and Q
can you please show me the block diagram and the graph from matlab for question 3? 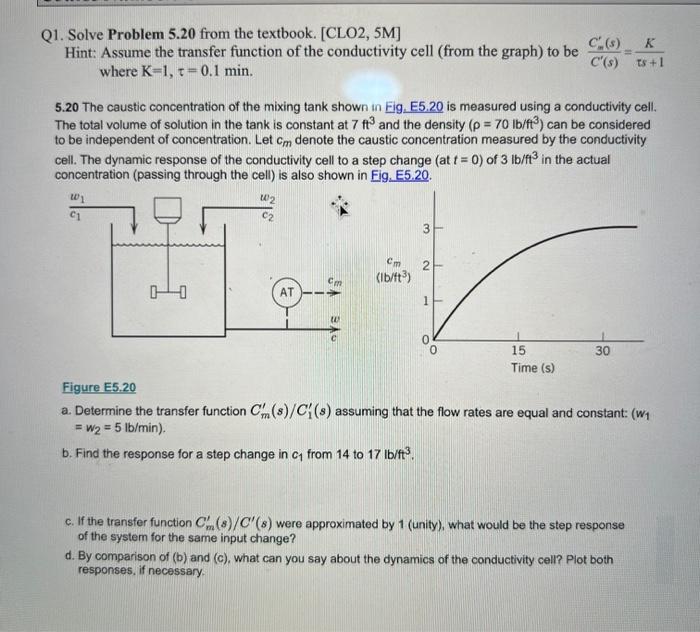
there are 3 questions: 5.20 , 6.12 and Q 3 needs the graph for problem 5.20 and 6.12
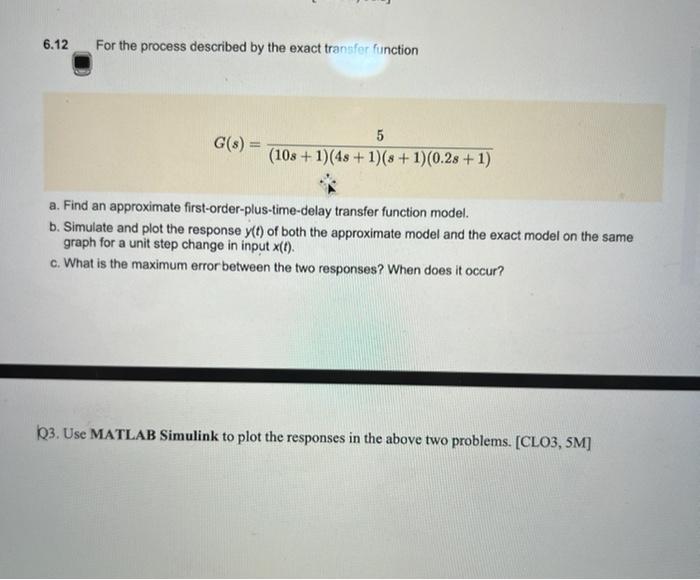
Q1. Solve Problem 5.20 from the textbook. [CLO2, 5M] Hint: Assume the transfer function of the conductivity cell (from the graph) to be where K=1, r=0.1 min. c(s) C'(s) ts + 1 5.20 The caustic concentration of the mixing tank shown in Eig. E5,20 is measured using a conductivity cell. The total volume of solution in the tank is constant at 7 ft and the density (p = 70 lb/ft) can be considered to be independent of concentration. Let om denote the caustic concentration measured by the conductivity cell. The dynamic response of the conductivity cell to a step change (at t = 0) of 3 lb/ft in the actual concentration (passing through the cell) is also shown in Fig. E5.20. w 102 C1 3 2 N cm (1b/ft3) m AT 0 30 15 Time (s) Figure E5.20 a. Determine the transfer function Cm(s)/C () assuming that the flow rates are equal and constant: (w1 = W2 = 5 lb/min). b. Find the response for a step change in C1 from 14 to 17 lb/ft? c. If the transfer function C(s)/C'(s) were approximated by 1 (unity), what would be the step response of the system for the same input change? d. By comparison of (b) and (c), what can you say about the dynamics of the conductivity cell? Plot both responses, if necessary. 6.12 For the process described by the exact transfor function G(8) = 5 (108 + 1)(48 + 1)(8 + 1)(0.28 +1) a. Find an approximate first-order-plus-time-delay transfer function model. b. Simulate and plot the response y(t) of both the approximate model and the exact model on the same graph for a unit step change in input x(t). c. What is the maximum error between the two responses? When does it occur? 3. Use MATLAB Simulink to plot the responses in the above two problems. [CLO3, SM] Step by Step Solution
There are 3 Steps involved in it
Step: 1

Get Instant Access to Expert-Tailored Solutions
See step-by-step solutions with expert insights and AI powered tools for academic success
Step: 2

Step: 3
Ace Your Homework with AI
Get the answers you need in no time with our AI-driven, step-by-step assistance
Get Started
Elementary Principles of Chemical Processes
Authors: Richard M. Felder, Ronald W. Rousseau, Lisa G. Bullard
4th edition
978-1118431221, 9781119192138, 1118431227, 1119192137, 978-1119498759