Can you please work these out so I can understand it better
1
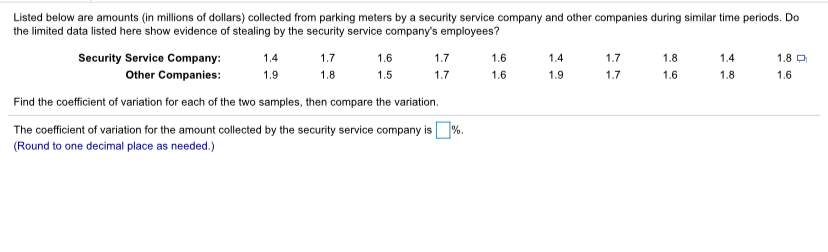
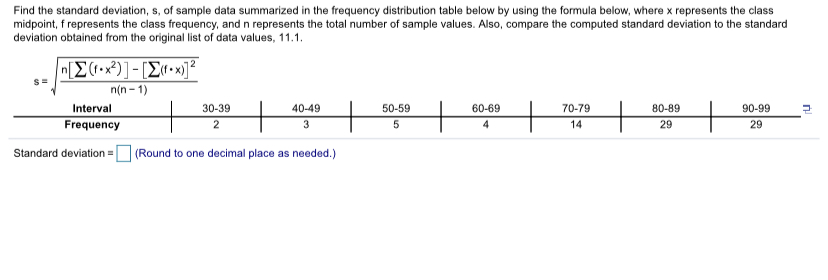
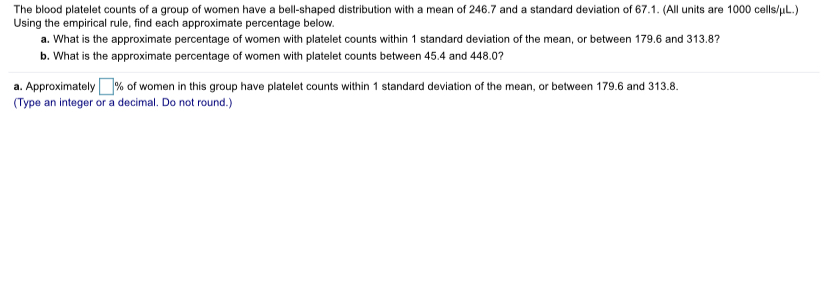
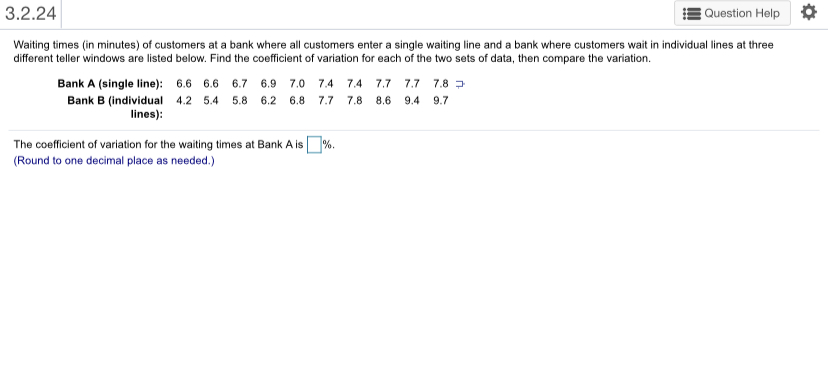
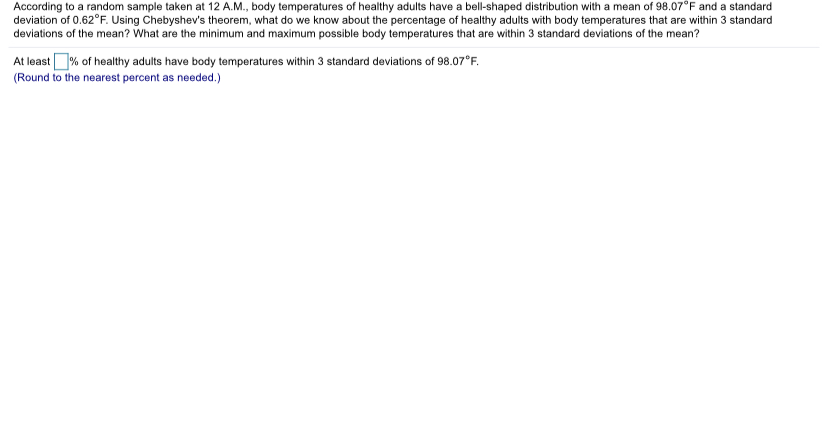
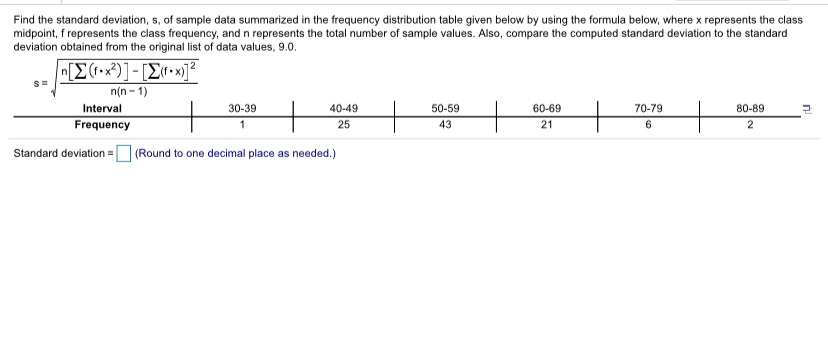
Listed below are amounts (in millions of dollars) collected from parking meters by a security service company and other companies during similar time periods. Do the limited data listed here show evidence of stealing by the security service company's employees? Security Service Company: 1.4 1.7 1.6 1.7 1.6 Other Companies: 1.4 1.9 1.7 1.8 1.8 1.4 1.5 1.7 1.8 0 1.6 1.9 1.7 1.6 1.8 1.6 Find the coefficient of variation for each of the two samples, then compare the variation. The coefficient of variation for the amount collected by the security service company is% (Round to one decimal place as needed.)Find the standard deviation, s, of sample data summarized in the frequency distribution table below by using the formula below, where x represents the class midpoint, f represents the class frequency, and n represents the total number of sample values. Also, compare the computed standard deviation to the standard deviation obtained from the original list of data values, 11.1. S= "[E(1.x )]- [(.x)]2 n(n - 1) Interval 30-39 40-49 50-59 60-69 70-79 80-89 90-99 Frequency 2 3 5 4 14 29 29 Standard deviation = (Round to one decimal place as needed.)The blood platelet counts of a group of women have a bell-shaped distribution with a mean of 246.7 and a standard deviation of 67.1. (All units are 1000 cells/pL.) Using the empirical rule, find each approximate percentage below. a. What is the approximate percentage of women with platelet counts within 1 standard deviation of the mean, or between 179.6 and 313.8? b. What is the approximate percentage of women with platelet counts between 45.4 and 448.07 a. Approximately % of women in this group have platelet counts within 1 standard deviation of the mean, or between 179.6 and 313.8. (Type an integer or a decimal. Do not round.)3.2.24 Question Help Waiting times (in minutes) of customers at a bank where all customers enter a single waiting line and a bank where customers wait in individual lines at three different teller windows are listed below. Find the coefficient of variation for each of the two sets of data, then compare the variation. Bank A (single line): 6.6 6.6 6.7 6.9 7.0 7.4 7.4 7.7 7.7 7.8 3 Bank B (individual 4.2 5.4 5.8 6.2 6.8 7.7 7.8 8.6 9.4 9.7 lines): The coefficient of variation for the waiting times at Bank A is %. (Round to one decimal place as needed.)According to a random sample taken at 12 A.M., body temperatures of healthy adults have a bell-shaped distribution with a mean of 98.07"F and a standard deviation of 0.62"F. Using Chebyshev's theorem, what do we know about the percentage of healthy adults with body temperatures that are within 3 standard deviations of the mean? What are the minimum and maximum possible body temperatures that are within 3 standard deviations of the mean? At least % of healthy adults have body temperatures within 3 standard deviations of 98.07"F. (Round to the nearest percent as needed.)Find the standard deviation, s, of sample data summarized in the frequency distribution table given below by using the formula below, where x represents the class midpoint, f represents the class frequency, and n represents the total number of sample values. Also, compare the computed standard deviation to the standard deviation obtained from the original list of data values, 9.0. [E(fox?) ] - [E( .x)]2 n(n - 1) Interval 30-39 40-49 50-59 60-69 70-79 80-89 Frequency 25 43 21 6 2 Standard deviation = (Round to one decimal place as needed.)