Answered step by step
Verified Expert Solution
Question
1 Approved Answer
can you pls help me on this question. Comparative financial statements for The Blossom Company Ltd. are shown below. THE BLOSSOM COMPANY LTD. Income Statement
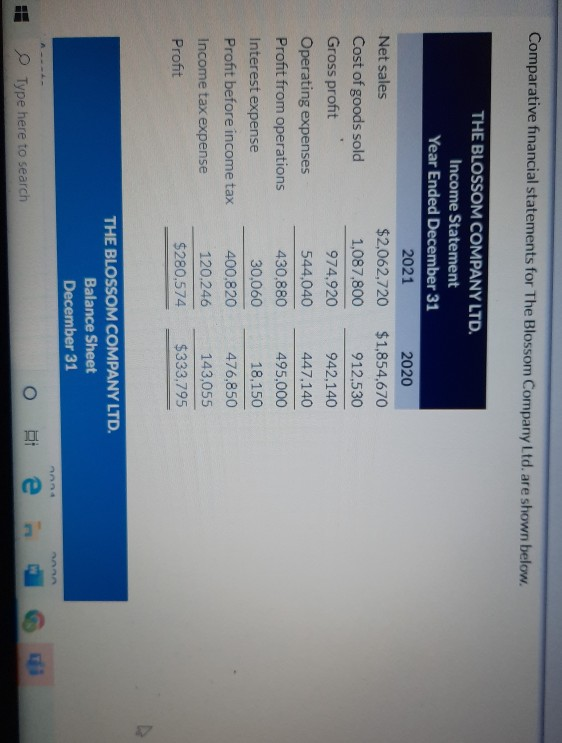
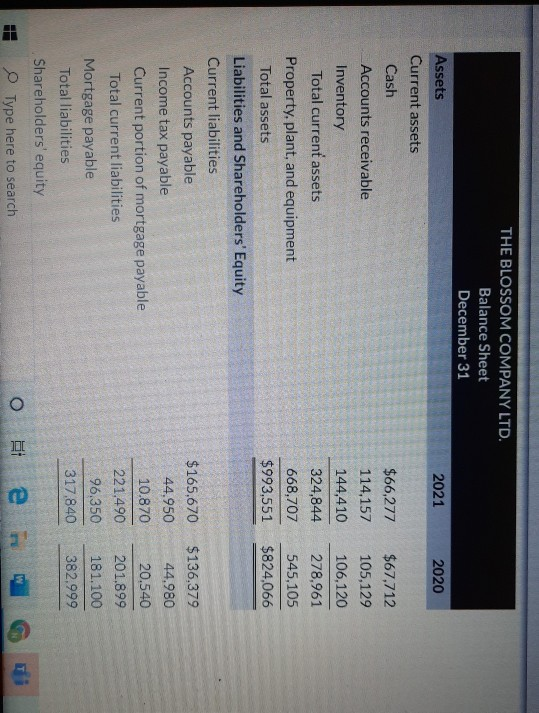
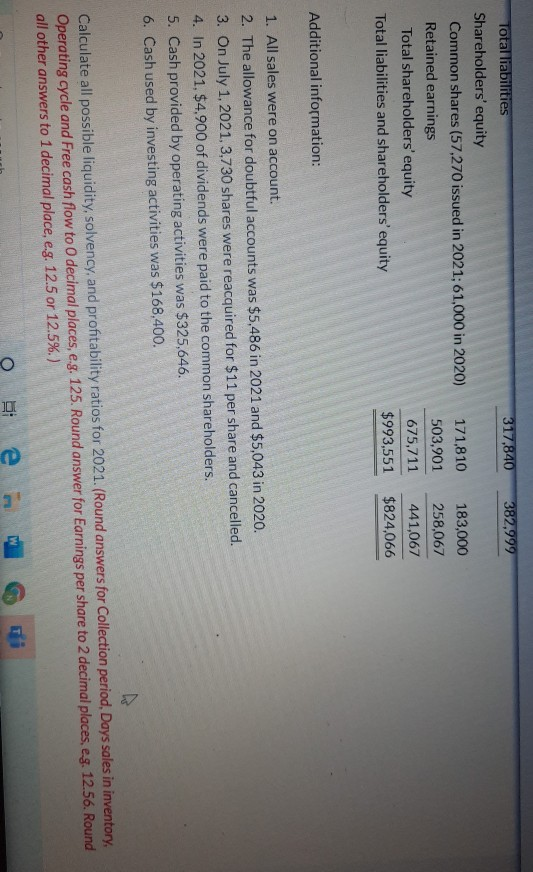
can you pls help me on this question.
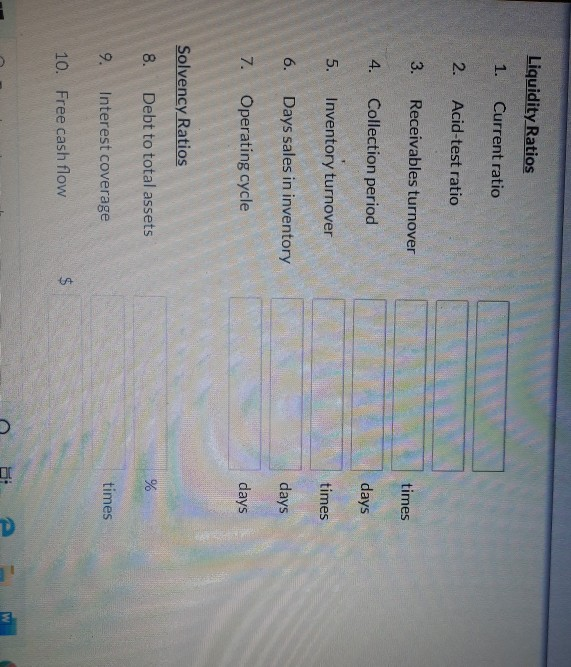
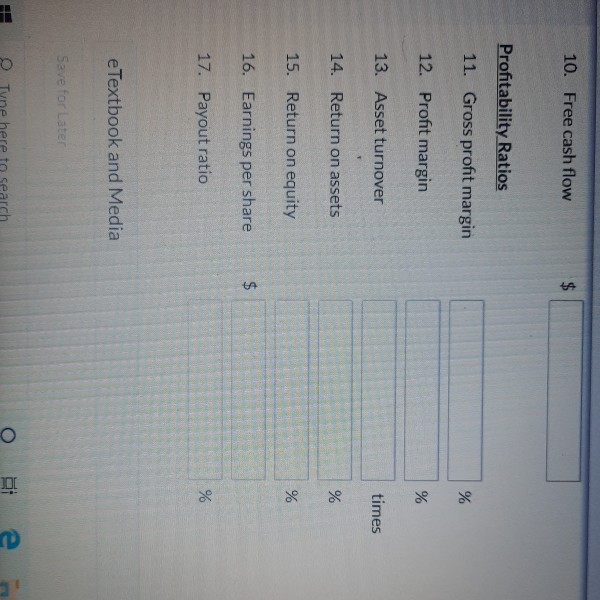
Comparative financial statements for The Blossom Company Ltd. are shown below. THE BLOSSOM COMPANY LTD. Income Statement Year Ended December 31 2021 2020 Net sales $2,062,720 $1,854,670 Cost of goods sold 1,087,800 912,530 Gross profit 974.920 942,140 Operating expenses 544,040 447.140 Profit from operations 430.880 495.000 Interest expense 30.060 18.150 Profit before income tax 400.820 476,850 Income tax expense 120.246 143,055 Profit $280.574 $333,795 THE BLOSSOM COMPANY LTD. Balance Sheet December 31 Type here to search 2021 2020 $66,277 114,157 144,410 324,844 $67,712 105,129 106,120 278,961 545,105 $824,066 668,707 $993,551 THE BLOSSOM COMPANY LTD. Balance Sheet December 31 Assets Current assets Cash Accounts receivable Inventory Total current assets Property, plant, and equipment Total assets Liabilities and Shareholders' Equity Current liabilities Accounts payable Income tax payable Current portion of mortgage payable Total current liabilities Mortgage payable Total liabilities Shareholders' equity Type here to search $136,379 44,980 20.540 $165.670 44,950 10.870 221,490 96.350 317.840 201.899 181.100 382.999 O it e 317,840 382,999 Total liabilities Shareholders' equity Common shares (57.270 issued in 2021; 61,000 in 2020) Retained earnings Total shareholders' equity Total liabilities and shareholders' equity 171.810 503,901 675,711 $993,551 183,000 258,067 441,067 $824,066 Additional information: 1. All sales were on account. 2. The allowance for doubtful accounts was $5,486 in 2021 and $5,043 in 2020. 3. On July 1, 2021,3,730 shares were reacquired for $11 per share and cancelled. 4. In 2021, $4.900 of dividends were paid to the common shareholders. 5. Cash provided by operating activities was $325,646. 6. Cash used by investing activities was $168,400. Calculate all possible liquidity, solvency, and profitability ratios for 2021. (Round answers for Collection period, Days sales in inventory, Operating cycle and Free cash flow to 0 decimal places, eg. 125. Round answer for Earnings per share to 2 decimal places, eg. 12.56. Round all other answers to 1 decimal place, e.g. 12.5 or 12.5%) e o Liquidity Ratios 1. Current ratio 2. Acid-test ratio 3. Receivables turnover times 4. Collection period days 5. Inventory turnover times 6. Days sales in inventory days 7. Operating cycle days Solvency Ratios 8. Debt to total assets % 9. Interest coverage times 10. Free cash flow $ n 10. Free cash flow $ Profitability Ratios 11. Gross profit margin % 12. Profit margin % 13. Asset turnover times 14. Return on assets % 15. Return on equity % 16. Earnings per share $ 17. Payout ratio % e Textbook and Media Save for Later Tvre here to search e
Step by Step Solution
There are 3 Steps involved in it
Step: 1

Get Instant Access to Expert-Tailored Solutions
See step-by-step solutions with expert insights and AI powered tools for academic success
Step: 2

Step: 3

Ace Your Homework with AI
Get the answers you need in no time with our AI-driven, step-by-step assistance
Get Started


