Answered step by step
Verified Expert Solution
Question
1 Approved Answer
Cancer deaths: Suppose for a set of counties i = {1,...,n} we have infor- mation on the population size X number of people in


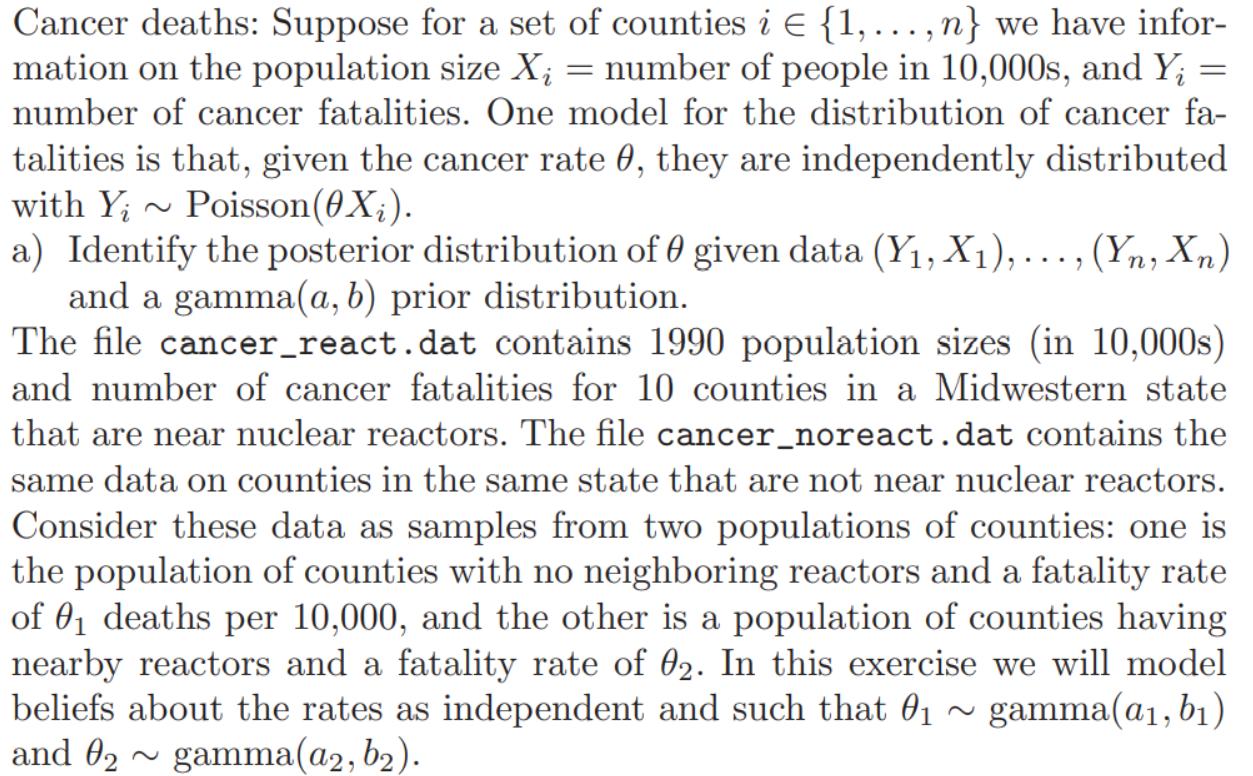
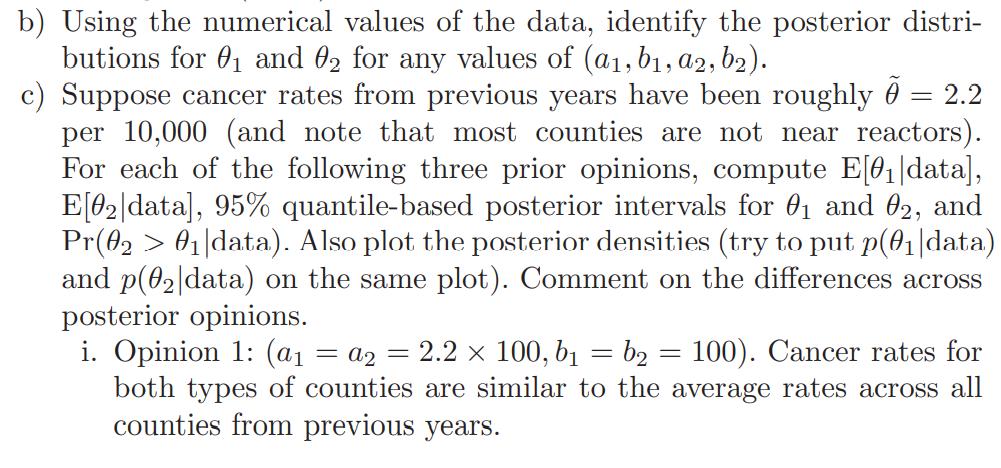
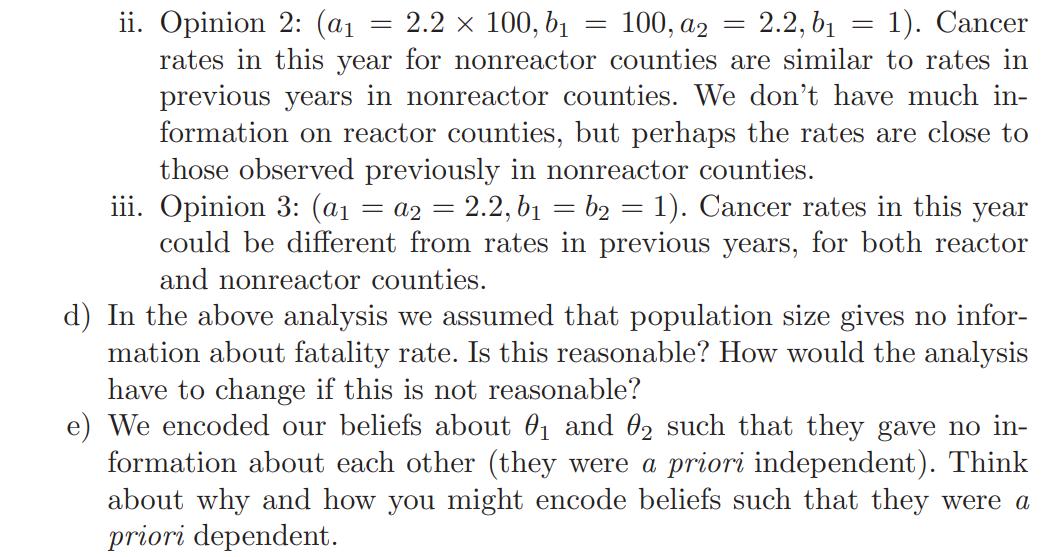
Cancer deaths: Suppose for a set of counties i = {1,...,n} we have infor- mation on the population size X number of people in 10,000s, and Y number of cancer fatalities. One model for the distribution of cancer fa- = = talities is that, given the cancer rate 0, they are independently distributed with Y; Poisson (0X;). a) Identify the posterior distribution of given data (Y, X),..., (Yn, Xn) and a gamma(a, b) prior distribution. The file cancer_react.dat contains 1990 population sizes (in 10,000s) and number of cancer fatalities for 10 counties in a Midwestern state that are near nuclear reactors. The file cancer_noreact.dat contains the same data on counties in the same state that are not near nuclear reactors. Consider these data as samples from two populations of counties: one is the population of counties with no neighboring reactors and a fatality rate of deaths per 10,000, and the other is a population of counties having nearby reactors and a fatality rate of 02. In this exercise we will model beliefs about the rates as independent and such that 0 gamma (a, b) and 0 gamma(a2, b). 02 b) Using the numerical values of the data, identify the posterior distri- butions for and 2 for any values of (a1, b1, a2, b2). c) Suppose cancer rates from previous years have been roughly 0 = 2.2 per 10,000 (and note that most counties are not near reactors). For each of the following three prior opinions, compute E[0|data], E[02/data], 95% quantile-based posterior intervals for 0 and 02, and Pr(02 > 01|data). Also plot the posterior densities (try to put p(0|data) and p(02|data) on the same plot). Comment on the differences across posterior opinions. = i. Opinion 1: (a =a2 = 2.2 x 100, b b2 = 100). Cancer rates for both types of counties are similar to the average rates across all counties from previous years. 100, a2 ii. Opinion 2: (a = 2.2 100, b 2.2, b = 1). Cancer rates in this year for nonreactor counties are similar to rates in previous years in nonreactor counties. We don't have much in- formation on reactor counties, but perhaps the rates are close to those observed previously in nonreactor counties. = iii. Opinion 3: (a =a2 = 2.2, b b2 = 1). Cancer rates in this year could be different from rates in previous years, for both reactor and nonreactor counties. = = d) In the above analysis we assumed that population size gives no infor- mation about fatality rate. Is this reasonable? How would the analysis have to change if this is not reasonable? e) We encoded our beliefs about and 2 such that they gave no in- formation about each other (they were a priori independent). Think about why and how you might encode beliefs such that they were a priori dependent.
Step by Step Solution
★★★★★
3.44 Rating (157 Votes )
There are 3 Steps involved in it
Step: 1
2 2 a To identify the posterior distribution of given data 11Y1X1YnXn and a gamma ab prior distribut...
Get Instant Access to Expert-Tailored Solutions
See step-by-step solutions with expert insights and AI powered tools for academic success
Step: 2

Step: 3

Ace Your Homework with AI
Get the answers you need in no time with our AI-driven, step-by-step assistance
Get Started


