Answered step by step
Verified Expert Solution
Question
1 Approved Answer
Capitalize R&D expenses Estimate an Adjusted Operating Income Estimate net capital expenditure Estimate non cash working capital Estimate Free cash flow to firm Estimate Free
Capitalize R&D expenses
Estimate an Adjusted Operating Income
Estimate net capital expenditure
Estimate non cash working capital
Estimate Free cash flow to firm
Estimate Free Cash Flow to Equity
Estimate Growth in earnings from fundamentals
Choose a stage model and a length for the high growth period
Choose a DCF model
Value the firm/stock
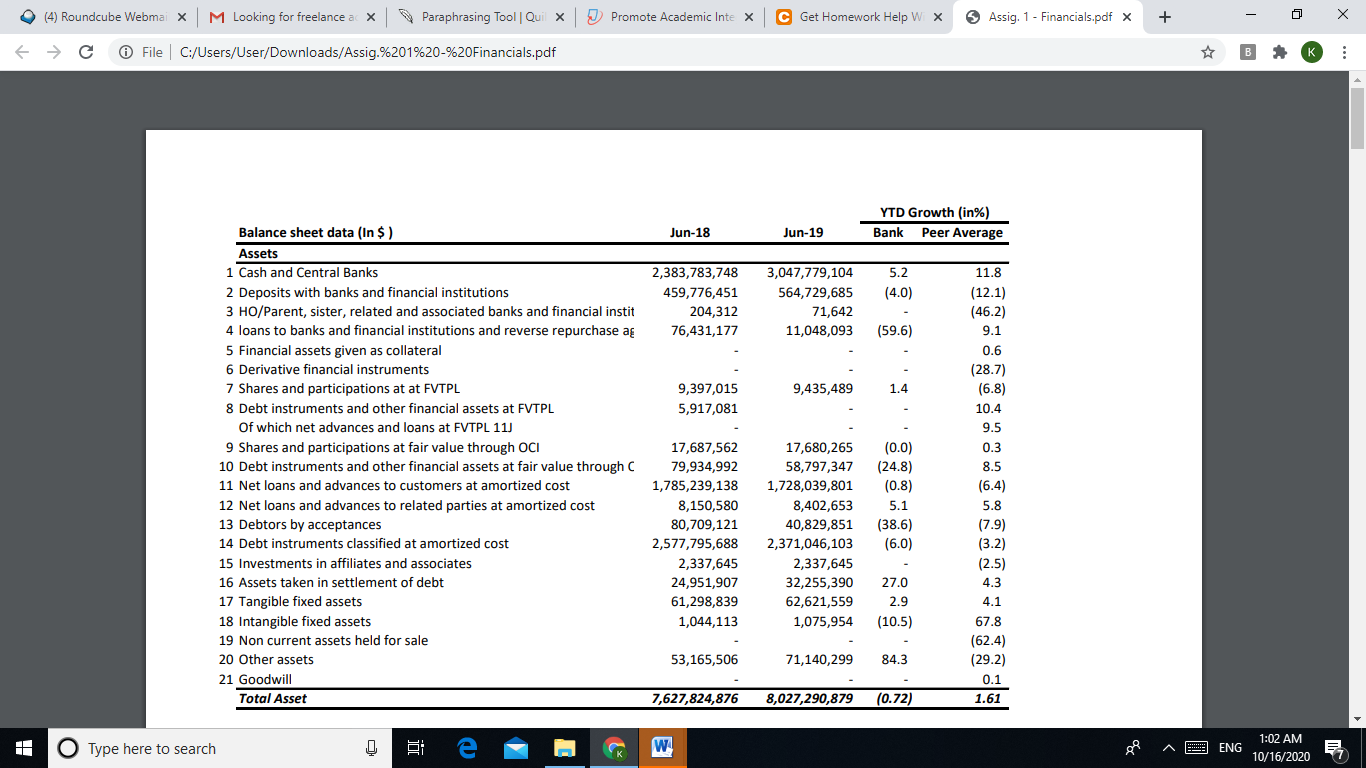
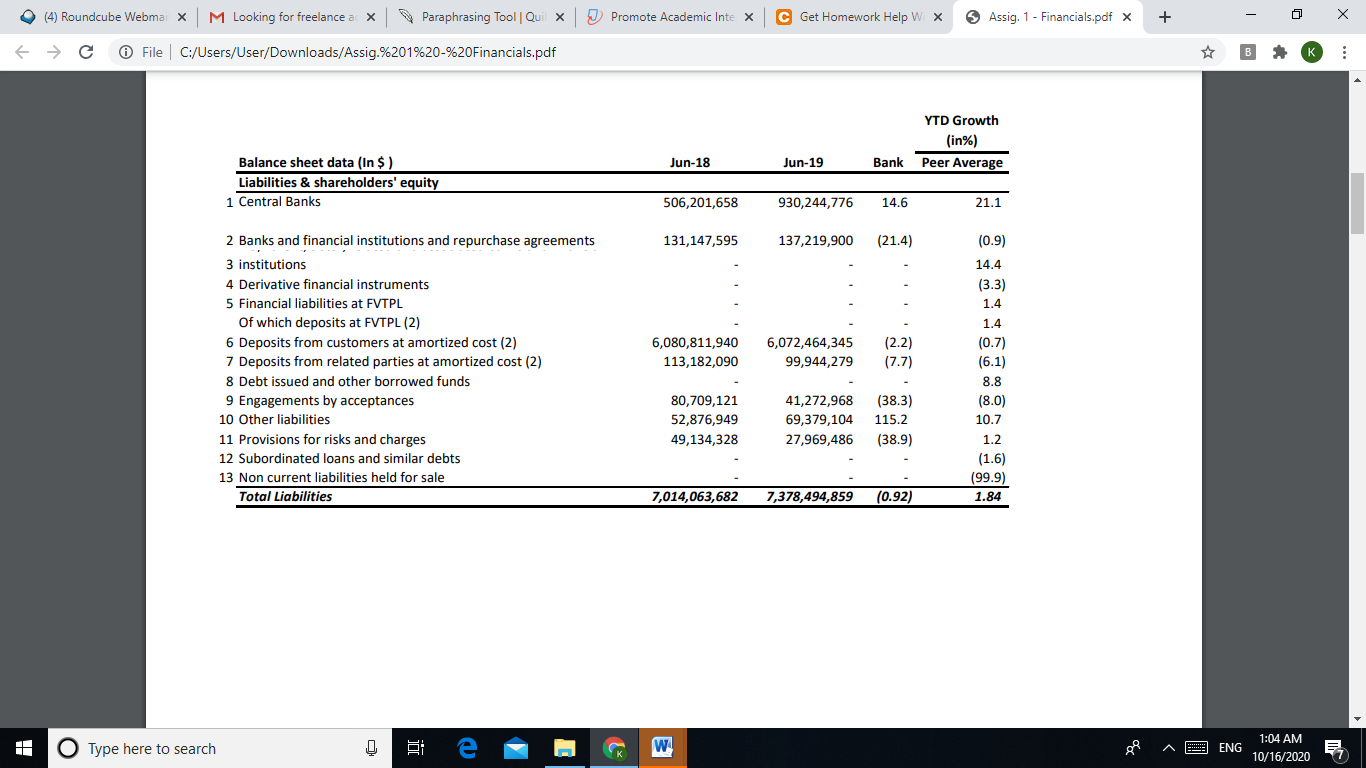
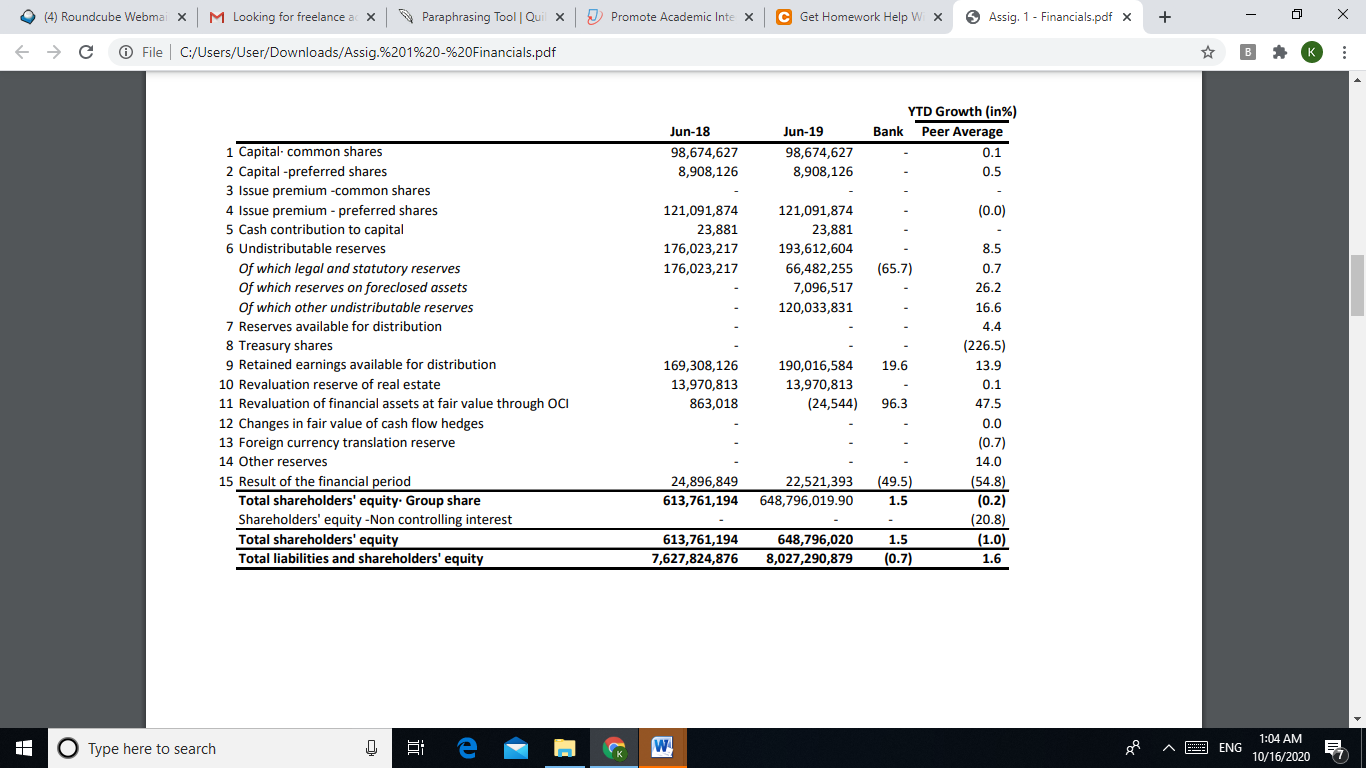
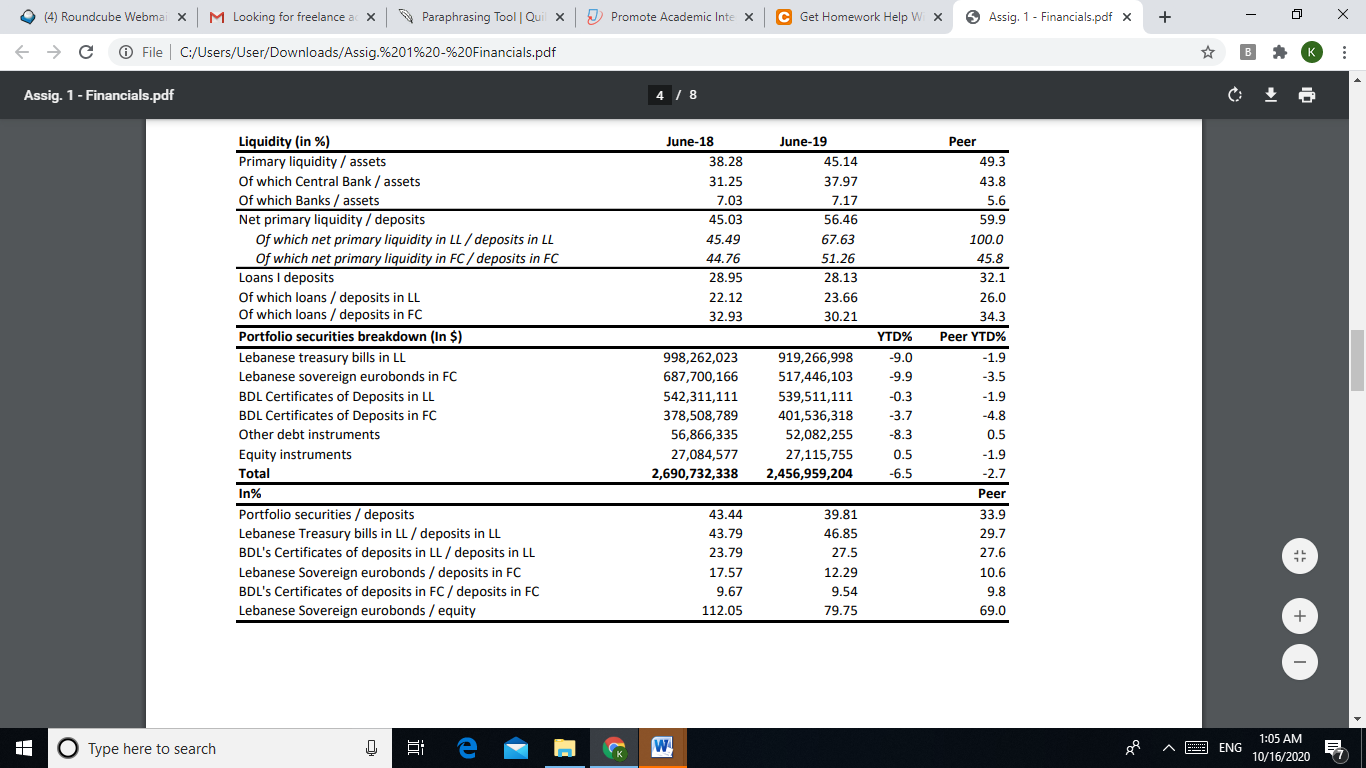
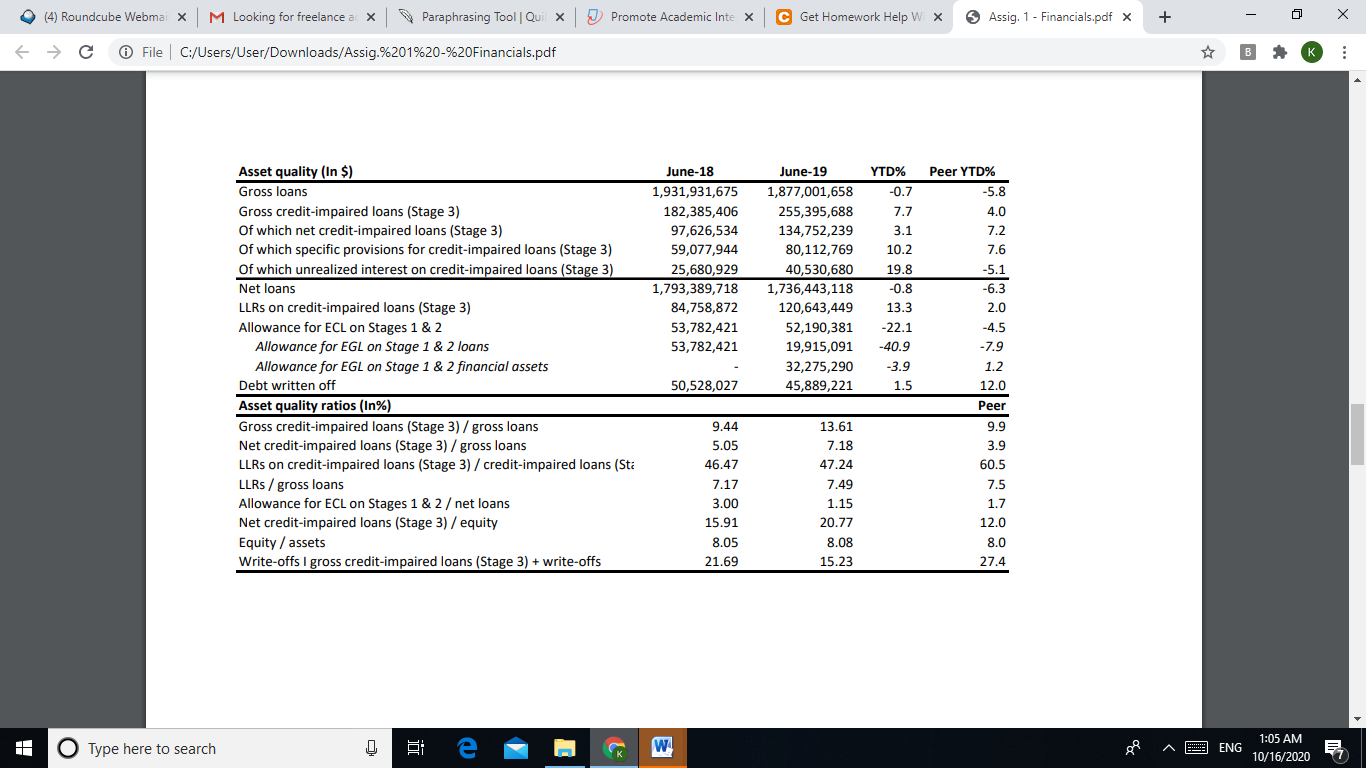
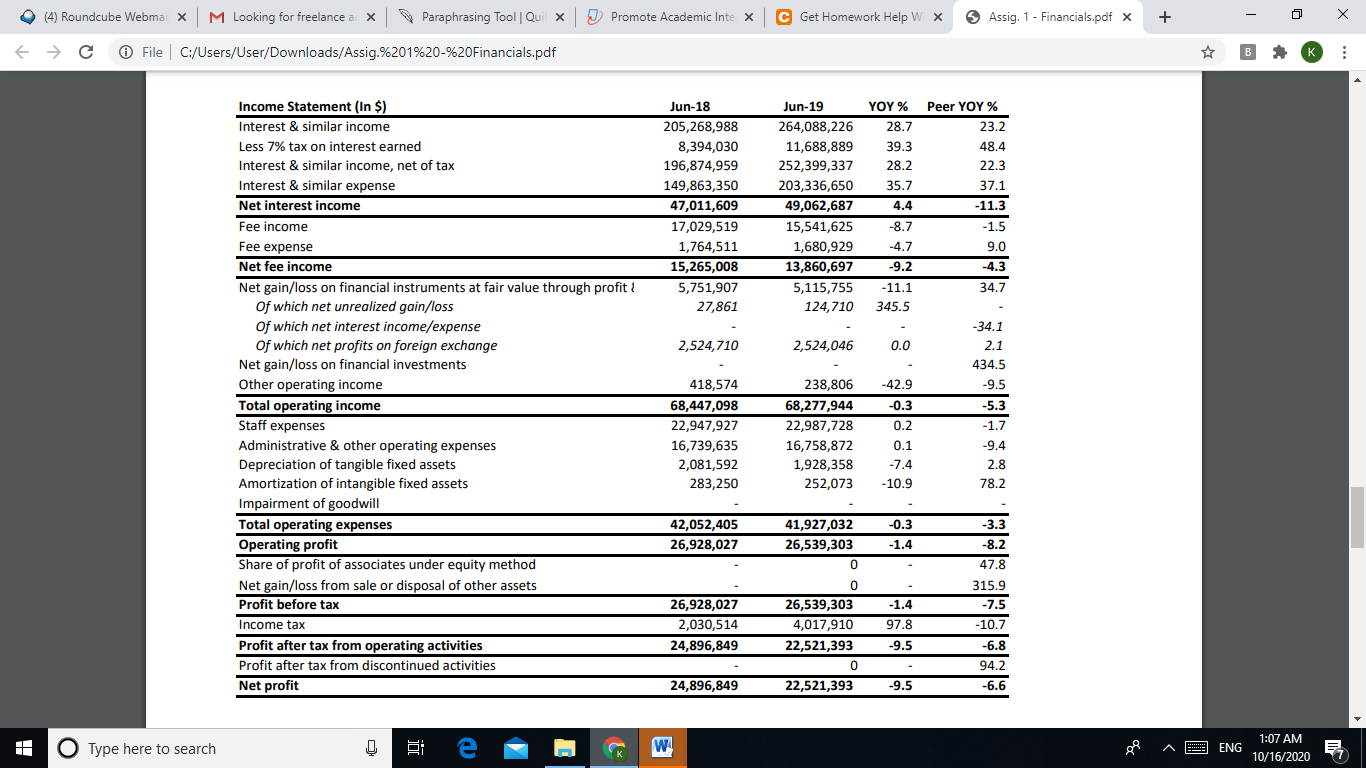
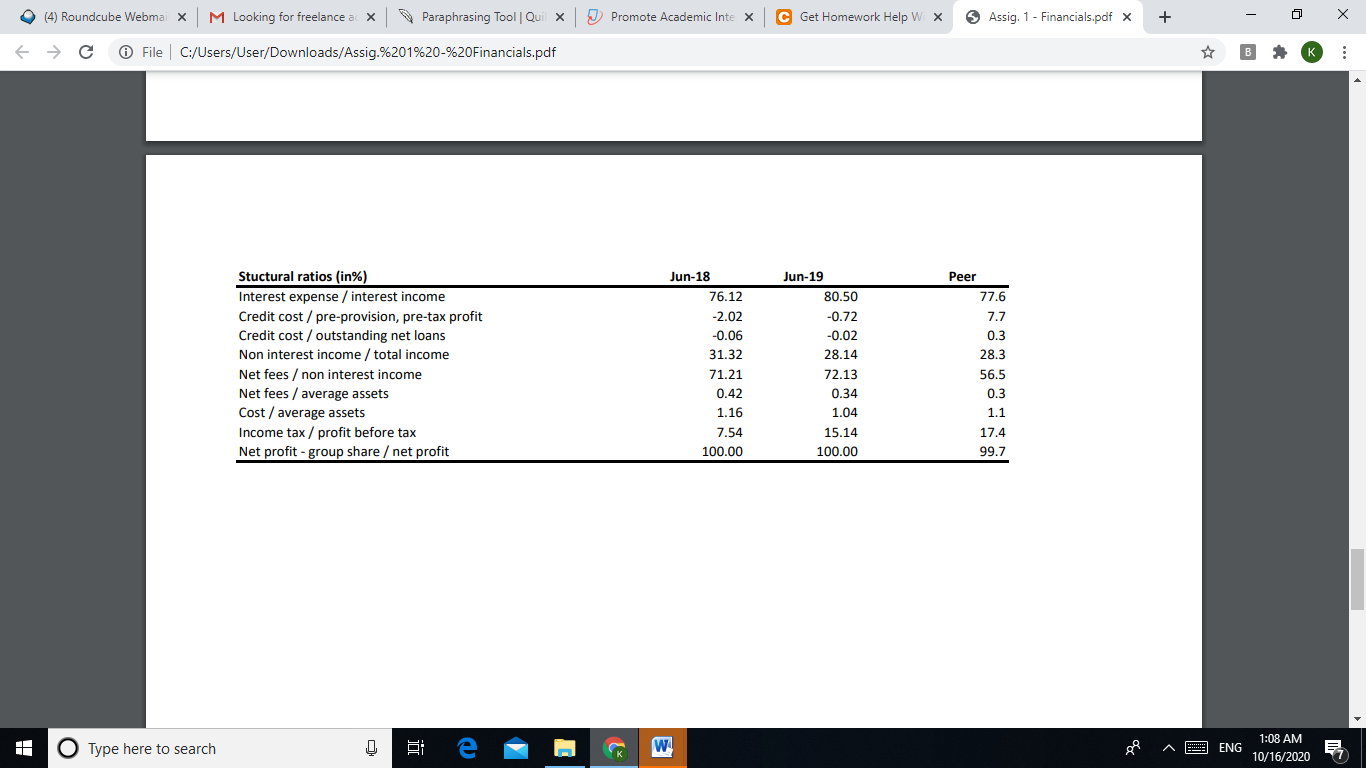
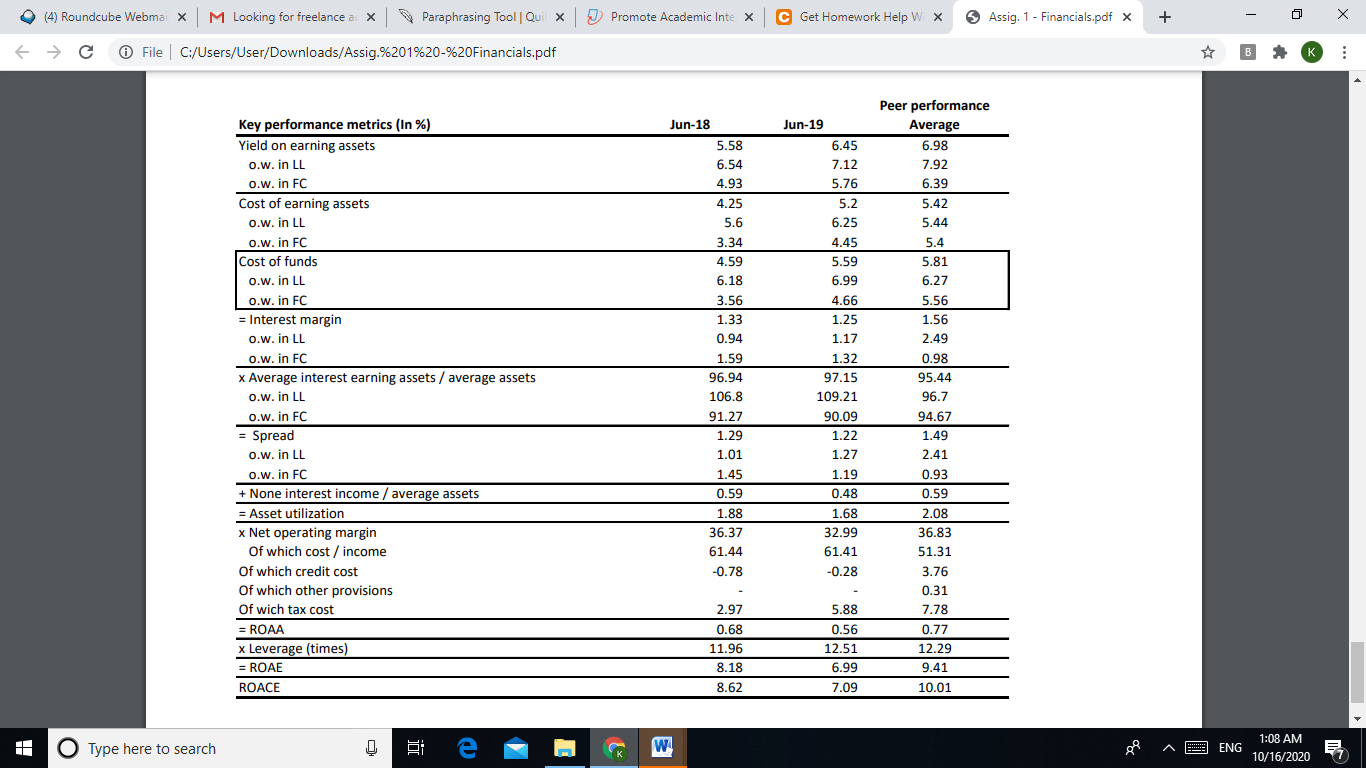
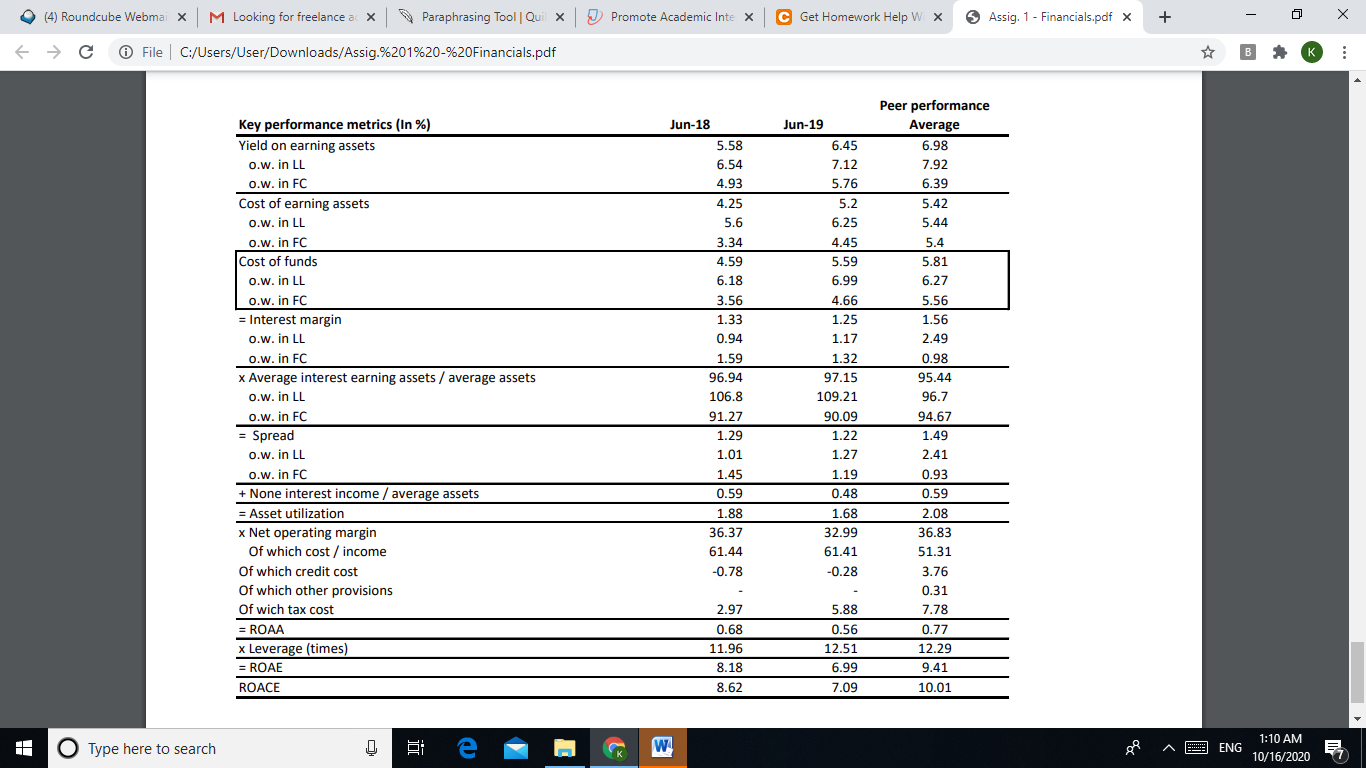
(4) Roundcube Webmai x M Looking for freelance a x Paraphrasing Tool Qui X Promote Academic Intex C Get Homework Help W X Assig. 1 - Financials.pdf x + File C:/Users/User/Downloads/Assig.%201%20-%20Financials.pdf YTD Growth (in%) Bank Peer Average Jun-18 Jun-19 5.2 (4.0) 2,383,783,748 459,776,451 204,312 76,431,177 3,047,779,104 564,729,685 71,642 11,048,093 (59.6) 9,435,489 1.4 9,397,015 5,917,081 Balance sheet data (In $ ) Assets 1 Cash and Central Banks 2 Deposits with banks and financial institutions 3 HO/Parent, sister, related and associated banks and financial instit 4 loans to banks and financial institutions and reverse repurchase ag 5 Financial assets given as collateral 6 Derivative financial instruments 7 Shares and participations at at FVTPL 8 Debt instruments and other financial assets at FVTPL Of which net advances and loans at FVTPL 11) 9 Shares and participations at fair value through OCI 10 Debt instruments and other financial assets at fair value through 11 Net loans and advances to customers at amortized cost 12 Net loans and advances to related parties at amortized cost 13 Debtors by acceptances 14 Debt instruments classified at amortized cost 15 Investments in affiliates and associates 16 Assets taken in settlement of debt 17 Tangible fixed assets 18 Intangible fixed assets 19 Non current assets held for sale 20 Other assets 21 Goodwill Total Asset (0.0) (24.8) (0.8) 5.1 17,687,562 79,934,992 1,785,239,138 8,150,580 80,709,121 2,577,795,688 2,337,645 24,951,907 61,298,839 1,044,113 (38.6) 11.8 (12.1) (46.2) 9.1 0.6 (28.7) (6.8) 10.4 9.5 0.3 8.5 (6.4) 5.8 (7.9) (3.2) (2.5) 4.3 4.1 67.8 (62.4) (29.2) 0.1 1.61 17,680,265 58,797,347 1,728,039,801 8,402,653 40,829,851 2,371,046,103 2,337,645 32,255,390 62,621,559 1,075,954 (6.0) 27.0 2.9 (10.5) 53,165,506 71,140,299 84.3 7,627,824,876 8,027,290,879 (0.72) O Type here to search g 1 ENG 1:02 AM 10/16/2020 7 (4) Roundcube Webmai x M Looking for freelance a x Paraphrasing Tool Qui X Promote Academic Inte X C Get Homework Help W X Assig. 1 - Financials.pdf x + File C:/Users/User/Downloads/Assig.%201%20-%20Financials.pdf YTD Growth (in%) Peer Average Jun-18 Jun-19 Bank Balance sheet data (In $) Liabilities & shareholders' equity 1 Central Banks 506,201,658 930,244,776 14.6 21.1 131,147,595 137,219,900 (21.4) 2 Banks and financial institutions and repurchase agreements 3 institutions 4 Derivative financial instruments 5 Financial liabilities at FVTPL Of which deposits at FVTPL (2) 6 Deposits from customers at amortized cost (2) 7 Deposits from related parties at amortized cost (2) 8 Debt issued and other borrowed funds 9 Engagements by acceptances 10 Other liabilities 11 Provisions for risks and charges 12 Subordinated loans and similar debts 13 Non current liabilities held for sale Total Liabilities 6,080,811,940 113,182,090 6,072,464,345 99,944,279 (2.2) (7.7) (0.9) 14.4 (3.3) 1.4 1.4 (0.7) (6.1) 8.8 (8.0) 10.7 1.2 (1.6) (99.9) 1.84 80,709,121 52,876,949 49,134,328 41,272,968 69,379,104 27,969,486 (38.3) 115.2 (38.9) 7,014,063,682 7,378,494,859 (0.92) O Type here to search 1 E x2 ENG 1:04 AM 10/16/2020 7 (4) Roundcube Webmai x M Looking for freelance a X Paraphrasing Tool Qui X Promote Academic Inte X C Get Homework Help W X Assig. 1 - Financials.pdf x + File C:/Users/User/Downloads/Assig.%201%20-%20Financials.pdf Jun-18 98,674,627 8,908,126 Jun-19 98,674,627 8,908,126 YTD Growth (in%) Bank Peer Average 0.1 0.5 (0.0) 121,091,874 23,881 176,023,217 176,023,217 121,091,874 23,881 193,612,604 66,482,255 7,096,517 120,033,831 (65.7) 1 Capital. common shares 2 Capital -preferred shares 3 Issue premium -common shares 4 Issue premium - preferred shares 5 Cash contribution to capital 6 Undistributable reserves Of which legal and statutory reserves Of which reserves on foreclosed assets Of which other undistributable reserves 7 Reserves available for distribution 8 Treasury shares 9 Retained earnings available for distribution 10 Revaluation reserve of real estate 11 Revaluation of financial assets at fair value through OCI 12 Changes in fair value of cash flow hedges 13 Foreign currency translation reserve 14 Other reserves 15 Result of the financial period Total shareholders' equity. Group share Shareholders' equity -Non controlling interest Total shareholders' equity Total liabilities and shareholders' equity 19.6 169,308,126 13,970,813 863,018 190,016,584 13,970,813 (24,544) 8.5 0.7 26.2 16.6 4.4 (226.5) 13.9 0.1 47.5 0.0 (0.7) 14.0 (54.8) (0.2) (20.8) 96.3 24,896,849 613,761,194 22,521,393 648,796,019.90 (49.5) 1.5 - (1.0) 613,761,194 7,627,824,876 648,796,020 8,027,290,879 1.5 (0.7) 1.6 O Type here to search e E x2 ENG 1:04 AM 10/16/2020 7 (4) Roundcube Webmai x M Looking for freelance a x Paraphrasing Tool Qui x Promote Academic Inte X C Get Homework Help W X Assig. 1 - Financials.pdf x + 0 File C:/Users/User/Downloads/Assig.%201%20-%20Financials.pdf Assig. 1 - Financials.pdf 4 / 8 Peer 49.3 43.8 5.6 59.9 June-18 38.28 31.25 7.03 45.03 45.49 44.76 28.95 22.12 32.93 June-19 45.14 37.97 7.17 56.46 67.63 51.26 28.13 23.66 30.21 100.0 Liquidity (in %) Primary liquidity / assets Of which Central Bank / assets Of which Banks / assets Net primary liquidity / deposits Of which net primary liquidity in LL / deposits in LL Of which net primary liquidity in FC/ deposits in FC Loans I deposits Of which loans / deposits in LL Of which loans / deposits in FC Portfolio securities breakdown (In $) Lebanese treasury bills in LL Lebanese sovereign eurobonds in FC BDL Certificates of Deposits in LL BDL Certificates of Deposits in FC Other debt instruments Equity instruments Total In% Portfolio securities / deposits Lebanese Treasury bills in LL / deposits in LL BDL's Certificates of deposits in LL / deposits in LL Lebanese Sovereign eurobonds / deposits in FC BDL's Certificates of deposits in FC / deposits in FC Lebanese Sovereign eurobonds / equity 45.8 32.1 26.0 34.3 Peer YTD% -1.9 -3.5 -1.9 -4.8 998,262,023 687,700,166 542,311,111 378,508,789 56,866,335 27,084,577 2,690,732,338 YTD% -9.0 -9.9 -0.3 -3.7 -8.3 0.5 -6.5 919,266,998 517,446,103 539,511,111 401,536,318 52,082,255 27,115,755 2,456,959,204 0.5 43.44 43.79 23.79 17.57 9.67 112.05 -- -1.9 -2.7 Peer 33.9 29.7 27.6 10.6 9.8 39.81 46.85 27.5 12.29 9.54 79.75 69.0 + O Type here to search ENG 1:05 AM 10/16/2020 7 (4) Roundcube Webmai x M Looking for freelance a x Paraphrasing Tool Qui x Promote Academic Inte X C Get Homework Help W X Assig. 1 - Financials.pdf x + File C:/Users/User/Downloads/Assig.%201%20-%20Financials.pdf YTD% Peer YTD% -5.8 -0.7 7.7 3.1 4.0 7.2 7.6 June-18 1,931,931,675 182,385,406 97,626,534 59,077,944 25,680,929 1,793,389,718 84,758,872 53,782,421 53,782,421 Asset quality (In $) Gross loans Gross credit-impaired loans (Stage 3) Of which net credit-impaired loans (Stage 3) Of which specific provisions for credit-impaired loans (Stage 3) Of which unrealized interest on credit-impaired loans (Stage 3) Net loans LLRs on credit-impaired loans (Stage 3) Allowance for ECL on Stages 1 & 2 Allowance for EGL on Stage 1 & 2 loans Allowance for EGL on Stage 1 & 2 financial assets Debt written off Asset quality ratios (In%) Gross credit-impaired loans (Stage 3) / gross loans Net credit-impaired loans (Stage 3) / gross loans LLRs on credit-impaired loans (Stage 3) / credit-impaired loans (Sti LLRs / gross loans Allowance for ECL on Stages 1 & 2 / net loans Net credit-impaired loans (Stage 3) / equity Equity / assets Write-offs I gross credit-impaired loans (Stage 3) + write-offs June-19 1,877,001,658 255,395,688 134,752,239 80,112,769 40,530,680 1,736,443,118 120,643,449 52,190,381 19,915,091 32,275,290 45,889,221 10.2 19.8 -0.8 13.3 -22.1 -40.9 -3.9 1.5 -5.1 -6.3 2.0 -4.5 -7.9 1.2 12.0 Peer 50,528,027 9.44 5.05 46.47 7.17 3.00 15.91 8.05 21.69 13.61 7.18 47.24 7.49 1.15 20.77 8.08 15.23 9.9 3.9 60.5 7.5 1.7 12.0 8.0 27.4 O Type here to search 1 E 2 ENG 1:05 AM 10/16/2020 7 (4) Roundcube Webmai x M Looking for freelance a X Paraphrasing Tool Qui x Promote Academic Inte X C Get Homework Help W X Assig. 1 - Financials.pdf x + File C:/Users/User/Downloads/Assig.%201%20-%20Financials.pdf YOY % 28.7 39.3 28.2 35.7 Jun-18 205,268,988 8,394,030 196,874,959 149,863,350 47,011,609 17,029,519 1,764,511 15,265,008 5,751,907 27,861 Jun-19 264,088,226 11,688,889 252,399,337 203,336,650 49,062,687 15,541,625 1,680,929 13,860,697 5,115,755 124,710 Peer YOY % 23.2 48.4 22.3 37.1 -11.3 4.4 -1.5 -8.7 -4.7 -9.2 9.0 -4.3 34.7 - 11.1 345.5 2,524,710 2,524,046 0.0 Income Statement (In $) Interest & similar income Less 7% tax on interest earned Interest & similar income, net of tax Interest & similar expense Net interest income Fee income Fee expense Net fee income Net gain/loss on financial instruments at fair value through profit Of which net unrealized gain/loss Of which net interest income/expense Of which net profits on foreign exchange Net gain/loss on financial investments Other operating income Total operating income Staff expenses Administrative & other operating expenses Depreciation of tangible fixed assets Amortization of intangible fixed assets Impairment of goodwill Total operating expenses Operating profit Share of profit of associates under equity method Net gain/loss from sale or disposal of other assets Profit before tax Income tax Profit after tax from operating activities Profit after tax from discontinued activities Net profit 418,574 68,447,098 22,947,927 16,739,635 2,081,592 283,250 238,806 68,277,944 22,987,728 16,758,872 1,928,358 252,073 -42.9 -0.3 0.2 0.1 -7.4 - 10.9 -34.1 2.1 434.5 -9.5 -5.3 -1.7 -9.4 2.8 78.2 42,052,405 26,928,027 41,927,032 26,539,303 0 -0.3 -1.4 -3.3 -8.2 47.8 315.9 -7.5 -10.7 -6.8 -1.4 26,928,027 2,030,514 24,896,849 0 26,539,303 4,017,910 22,521,393 0 22,521,393 97.8 -9.5 94.2 24,896,849 -9.5 -6.6 j Type here to search E *) ENG 1:07 AM 10/16/2020 7 (4) Roundcube Webmai x M Looking for freelance a x Paraphrasing Tool Qui X Promote Academic Inte X C Get Homework Help W X Assig. 1 - Financials.pdf x + File C:/Users/User/Downloads/Assig.%201%20-%20Financials.pdf Stuctural ratios (in%) Interest expense / interest income Credit cost / pre-provision, pre-tax profit Credit cost / outstanding net loans Non interest income / total income Net fees / non interest income Net fees / average assets Cost / average assets Income tax / profit before tax Net profit - group share / net profit Jun-18 76.12 -2.02 -0.06 31.32 71.21 0.42 1.16 Jun-19 80.50 -0.72 -0.02 28.14 72.13 0.34 1.04 15.14 100.00 Peer 77.6 7.7 0.3 28.3 56.5 0.3 1.1 17.4 99.7 7.54 100.00 O Type here to search 1 E x] ENG 1:08 AM 10/16/2020 (4) Roundcube Webmai x M Looking for freelance a X Paraphrasing Tool Qui X Promote Academic Intex C Get Homework Help W X Assig. 1 - Financials.pdf x + File C:/Users/User/Downloads/Assig.%201%20-%20Financials.pdf B Key performance metrics (in %) Yield on earning assets o.w. in LL 0.w. in FC Cost of earning assets o.w. in LL o.w. in FC Cost of funds 0.w. in LL o.w. in FC = Interest margin 0.w. in LL 0.w. in FC x Average interest earning assets / average assets o.w. in LL 0.w. in FC = Spread 0.w. in LL 0.w. in FC + None interest income / average assets = Asset utilization x Net operating margin Of which cost / income of which credit cost Of which other provisions Of wich tax cost = ROAA
Step by Step Solution
There are 3 Steps involved in it
Step: 1

Get Instant Access to Expert-Tailored Solutions
See step-by-step solutions with expert insights and AI powered tools for academic success
Step: 2

Step: 3

Ace Your Homework with AI
Get the answers you need in no time with our AI-driven, step-by-step assistance
Get Started


