

Answered step by step
Verified Expert Solution
Question
1 Approved Answer
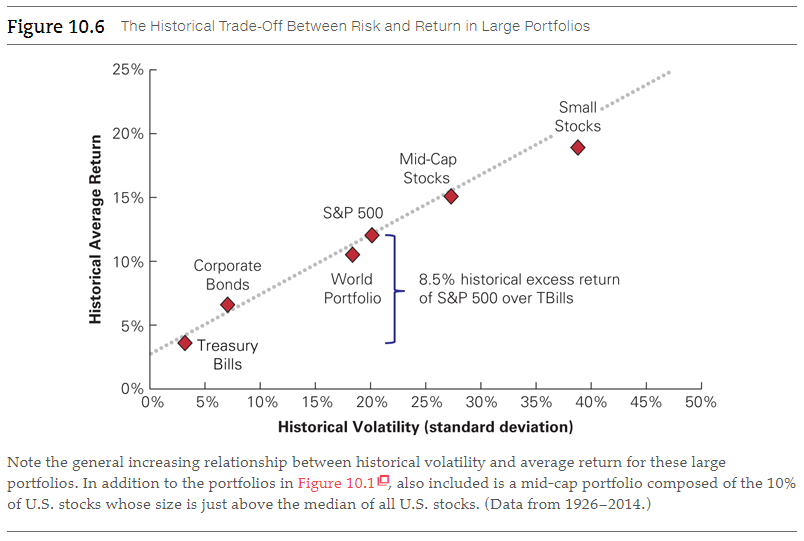
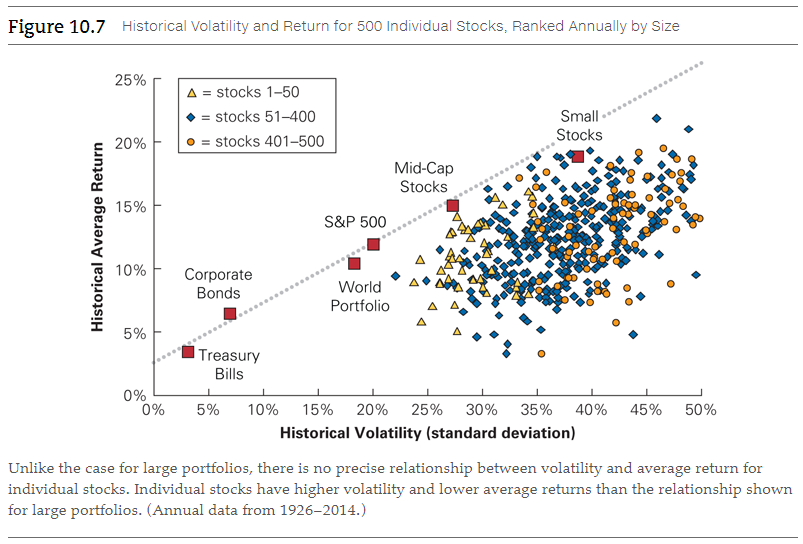
CAPM predicts that a security's risk premium increase in proportion to its beta of the security, not its volatility. Justify this statement using Figures 10.6
CAPM predicts that a security's risk premium increase in proportion to its beta of the security, not its volatility. Justify this statement using Figures 10.6 and 10.7 in Chapter 10.
Step by Step Solution
There are 3 Steps involved in it
Step: 1

Get Instant Access to Expert-Tailored Solutions
See step-by-step solutions with expert insights and AI powered tools for academic success
Step: 2

Step: 3
Ace Your Homework with AI
Get the answers you need in no time with our AI-driven, step-by-step assistance
Get Started
Begin Investing In Real Estate With The Ultimate Guide
Authors: Tadahikol T. Nakamura
1st Edition
979-8867848330