Capsim Help!! I need help with describing my round 1 by using Foundation FastTrack: low-tech segment, high-tech segment, and perceptual map. What did you learn from your decisions and rationale for the solutions you implemented in Round 1? What do your reports tell?
Need to know if there's a net loss or gain, contribution margin, accounts receivable
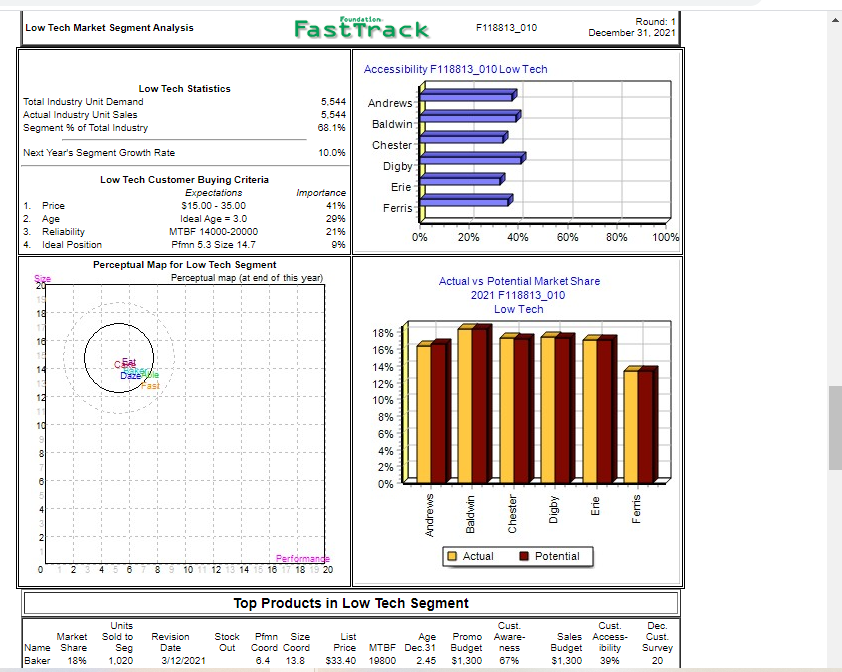
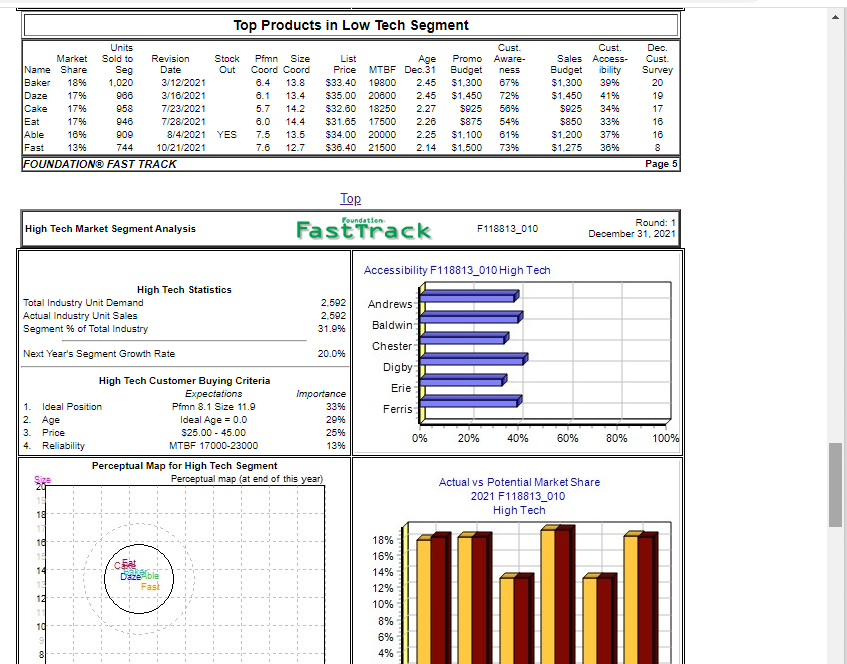
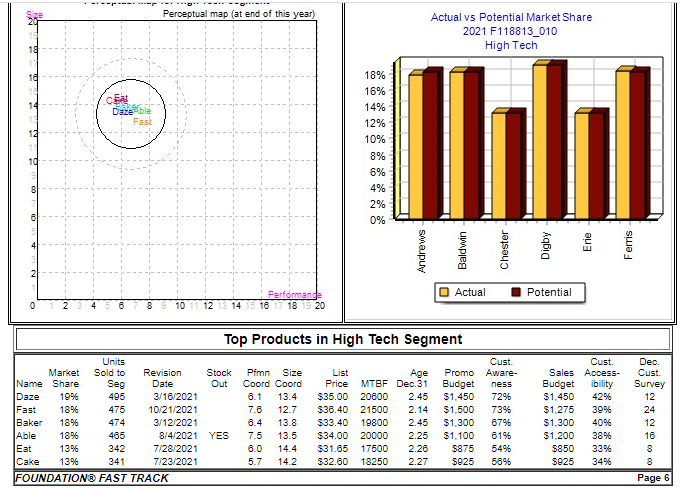
foundation Low Tech Market Segment Analysis Fast Track F118813_010 Round: 1 December 31, 2021 Accessibility F118813_010 Low Tech Andrews Low Tech Statistics Total Industry Unit Demand Actual Industry Unit Sales Segment % of Total Industry 5.544 5,544 68.1% Next Year's Segment Growth Rate 10.0% Baldwin Chester Digby Erie Ferris 1. 2. 3. 4. Age Low Tech Customer Buying Criteria Expectations Importance Price $15.00 - 35.00 4196 Ideal Age = 3.0 29% Reliability MTBF 14000-20000 2196 Ideal Position Pfmn 5.3 Size 14.7 9% Perceptual Map for Low Tech Segment Perceptual map (at end of this year) 0% 20% 40% 60% 80% 100% Actual vs Potential Market Share 2021 F118813_010 Low Tech 18 10 .cat Daze 12 18% 16% 14% 12% 10% 8% 6% 4% 2% 10 8 0% Andrews Baldwin Chester Erie Digby Ferris Ferris Actual Potential 0 Performande 10 11 12 13 14 15 16 17 18 19 20 2 4 8 Top Products in Low Tech Segment Market Name Share Baker 1896 Units Sold to Seg 1.020 Revision Date 3/12/2021 Stock Out Pfmn Size Coord Coord 6.4 13.8 List Price $33.40 Age MTBF Dec. 31 19800 2.45 Promo Budget $1.300 Cust. Aware- ness 67% Cust. Sales Access- Budget ibility $1,300 39% Dec. Cust. Survey 20 Top Products in Low Tech Segment Units Market Sold to Revision Stock Name Share Seg Date Out Baker 18% 1,020 3/12/2021 Daze 17% 966 3/16/2021 Cake 17% 958 7/23/2021 Eat 179% 946 7/28/2021 Able 1696 909 8/4/2021 YES Fast 1396 744 10/21/2021 FOUNDATION FAST TRACK Pimn Size Coord Coord 6.4 13.8 8.1 13.4 5.7 14.2 8.0 14.4 7.5 13.5 7.6 12.7 List Price $33.40 $35.00 $32.60 $31.65 $34.00 $36.40 Age MTBF Dec. 31 19800 2.45 20600 2.45 18250 2.27 17500 2.26 20000 2.25 21500 2.14 Promo Budget $1,300 $1.450 S925 $875 $1.100 $1.500 Cust. Aware- ness 67% 72% 58% 5496 61% 73% Cust. Sales Access- Budget ibility $1,300 39% $1,450 41% $925 34% $850 33% $1.200 3796 $1,275 36% Dec. Cust. Survey 20 19 17 16 16 8 Page 5 Top Foundation High Tech Market Segment Analysis Fast Track F118813_010 Round: 1 December 31, 2021 Accessibility F118813_010 High Tech High Tech Statistics Total Industry Unit Demand Actual Industry Unit Sales Segment % of Total Industry Andrews 2.592 2.592 31.9% Baldwin Next Year's Segment Growth Rate 20.0% Chester Digby Erie High Tech Customer Buying Criteria Expectations Ideal Position Pfmn 8.1 Size 11.9 2. Age Ideal Age = 0.0 3. Price $25.00 - 45.00 Reliability MTBF 17000-23000 Ferris Importance 3396 2996 2596 13% 0% 20% 40% 60% 80% 100% Perceptual Map for High Tech Segment Perceptual map (at end of this year) Actual vs Potential Market Share 2021 F118813_010 High Tech 18 10 CE Fast 18% 16% 14% 12% 10% 8% 6% 4% llll 10 Perceptual map (at end of this year) Actual vs Potential Market Share 2021 F118813_010 High Tech 18 cent 14 Dazeble 18% 16% 14% 12% 10% Illi 8% 6% 4% 2% 0% Andrews Erie Actual Potential Performande 18 0 12 4 8 Top Products in High Tech Segment Units Market Sold to Revision Stock Name Share Seg Date Out Daze 1996 495 3/16/2021 Fast 18% 475 10/21/2021 Baker 18% 474 3/12/2021 Able 18% 465 8/4/2021 YES Eat 1396 342 7/28/2021 Cake 13% 341 7/23/2021 FOUNDATION FAST TRACK Pfmn Size Coord Coord 6.1 13.4 7.6 12.7 6.4 13.8 7.5 13.5 6.0 14.4 5.7 14.2 List Price $35.00 $36.40 $33.40 $34.00 $31.65 $32.60 Age MTBF Dec. 31 20800 2.45 21500 2.14 19800 2.45 20000 2.25 17500 2.26 18250 2.27 Promo Budget $1.450 $1.500 $1.300 $1.100 $875 $925 Cust. Aware- ness 7296 73% 6796 61% 54% 58% Cust. Sales Access- Budget ibility $1.450 42% $1.275 3996 $1,300 40% $1.200 3896 $850 3396 $925 34% Dec Cust. Survey 12 24 12 16 8 8 Page 6 foundation Low Tech Market Segment Analysis Fast Track F118813_010 Round: 1 December 31, 2021 Accessibility F118813_010 Low Tech Andrews Low Tech Statistics Total Industry Unit Demand Actual Industry Unit Sales Segment % of Total Industry 5.544 5,544 68.1% Next Year's Segment Growth Rate 10.0% Baldwin Chester Digby Erie Ferris 1. 2. 3. 4. Age Low Tech Customer Buying Criteria Expectations Importance Price $15.00 - 35.00 4196 Ideal Age = 3.0 29% Reliability MTBF 14000-20000 2196 Ideal Position Pfmn 5.3 Size 14.7 9% Perceptual Map for Low Tech Segment Perceptual map (at end of this year) 0% 20% 40% 60% 80% 100% Actual vs Potential Market Share 2021 F118813_010 Low Tech 18 10 .cat Daze 12 18% 16% 14% 12% 10% 8% 6% 4% 2% 10 8 0% Andrews Baldwin Chester Erie Digby Ferris Ferris Actual Potential 0 Performande 10 11 12 13 14 15 16 17 18 19 20 2 4 8 Top Products in Low Tech Segment Market Name Share Baker 1896 Units Sold to Seg 1.020 Revision Date 3/12/2021 Stock Out Pfmn Size Coord Coord 6.4 13.8 List Price $33.40 Age MTBF Dec. 31 19800 2.45 Promo Budget $1.300 Cust. Aware- ness 67% Cust. Sales Access- Budget ibility $1,300 39% Dec. Cust. Survey 20 Top Products in Low Tech Segment Units Market Sold to Revision Stock Name Share Seg Date Out Baker 18% 1,020 3/12/2021 Daze 17% 966 3/16/2021 Cake 17% 958 7/23/2021 Eat 179% 946 7/28/2021 Able 1696 909 8/4/2021 YES Fast 1396 744 10/21/2021 FOUNDATION FAST TRACK Pimn Size Coord Coord 6.4 13.8 8.1 13.4 5.7 14.2 8.0 14.4 7.5 13.5 7.6 12.7 List Price $33.40 $35.00 $32.60 $31.65 $34.00 $36.40 Age MTBF Dec. 31 19800 2.45 20600 2.45 18250 2.27 17500 2.26 20000 2.25 21500 2.14 Promo Budget $1,300 $1.450 S925 $875 $1.100 $1.500 Cust. Aware- ness 67% 72% 58% 5496 61% 73% Cust. Sales Access- Budget ibility $1,300 39% $1,450 41% $925 34% $850 33% $1.200 3796 $1,275 36% Dec. Cust. Survey 20 19 17 16 16 8 Page 5 Top Foundation High Tech Market Segment Analysis Fast Track F118813_010 Round: 1 December 31, 2021 Accessibility F118813_010 High Tech High Tech Statistics Total Industry Unit Demand Actual Industry Unit Sales Segment % of Total Industry Andrews 2.592 2.592 31.9% Baldwin Next Year's Segment Growth Rate 20.0% Chester Digby Erie High Tech Customer Buying Criteria Expectations Ideal Position Pfmn 8.1 Size 11.9 2. Age Ideal Age = 0.0 3. Price $25.00 - 45.00 Reliability MTBF 17000-23000 Ferris Importance 3396 2996 2596 13% 0% 20% 40% 60% 80% 100% Perceptual Map for High Tech Segment Perceptual map (at end of this year) Actual vs Potential Market Share 2021 F118813_010 High Tech 18 10 CE Fast 18% 16% 14% 12% 10% 8% 6% 4% llll 10 Perceptual map (at end of this year) Actual vs Potential Market Share 2021 F118813_010 High Tech 18 cent 14 Dazeble 18% 16% 14% 12% 10% Illi 8% 6% 4% 2% 0% Andrews Erie Actual Potential Performande 18 0 12 4 8 Top Products in High Tech Segment Units Market Sold to Revision Stock Name Share Seg Date Out Daze 1996 495 3/16/2021 Fast 18% 475 10/21/2021 Baker 18% 474 3/12/2021 Able 18% 465 8/4/2021 YES Eat 1396 342 7/28/2021 Cake 13% 341 7/23/2021 FOUNDATION FAST TRACK Pfmn Size Coord Coord 6.1 13.4 7.6 12.7 6.4 13.8 7.5 13.5 6.0 14.4 5.7 14.2 List Price $35.00 $36.40 $33.40 $34.00 $31.65 $32.60 Age MTBF Dec. 31 20800 2.45 21500 2.14 19800 2.45 20000 2.25 17500 2.26 18250 2.27 Promo Budget $1.450 $1.500 $1.300 $1.100 $875 $925 Cust. Aware- ness 7296 73% 6796 61% 54% 58% Cust. Sales Access- Budget ibility $1.450 42% $1.275 3996 $1,300 40% $1.200 3896 $850 3396 $925 34% Dec Cust. Survey 12 24 12 16 8 8 Page 6