

Answered step by step
Verified Expert Solution
Question
1 Approved Answer
Capstone Capsims Round 1. R&D , marketing help needed please Table 2 Segment Centers at the End of Each Round: As shown in the Perceptual
Capstone Capsims Round 1. R&D , marketing 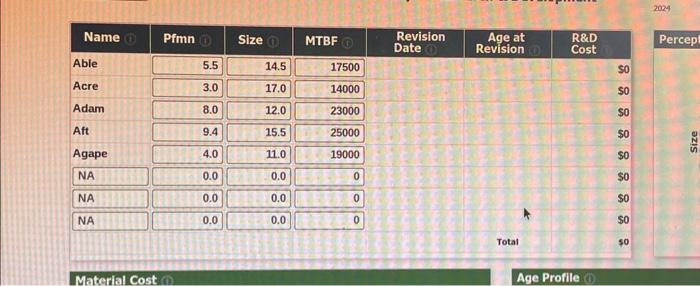
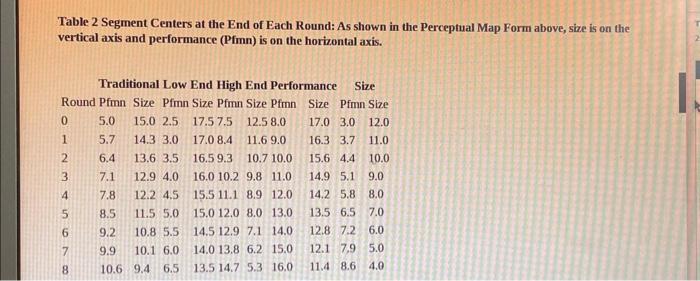
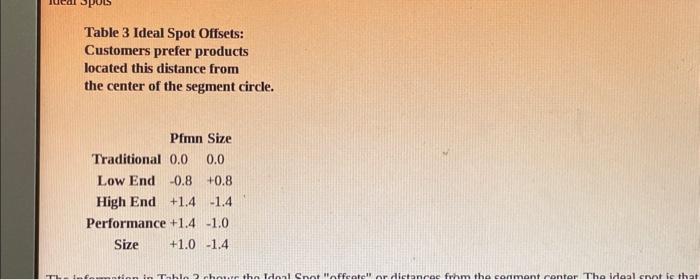
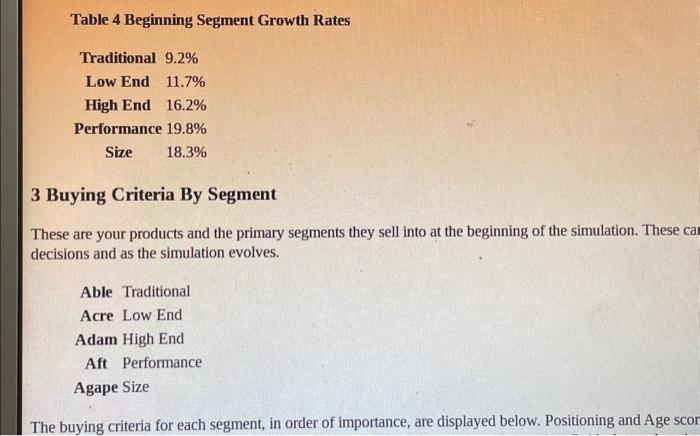
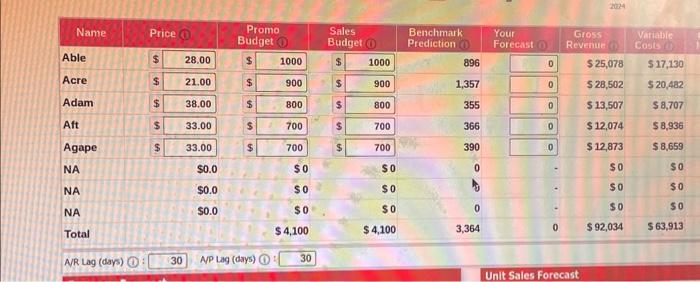
Table 2 Segment Centers at the End of Each Round: As shown in the Perceptual Map Form above, size is on the vertical axis and performance ( Pfmn) is on the horizontal axis. Table 4 Beginning Segment Growth Rates Traditional 9.2% Low End 11.7% High End 16.2% Performance 19.8% Size 18.3% 3 Buying Criteria By Segment These are your products and the primary segments they sell into at the beginning of the simulation. These ca decisions and as the simulation evolves. Able Traditional Acre Low End Adam High End Aft Performance Agape Size Table 3 Ideal Spot Offsets: Customers prefer products located this distance from the center of the segment circle. AR Lag (days) (1): 30 AP Lag (days) (1) : 30 Table 2 Segment Centers at the End of Each Round: As shown in the Perceptual Map Form above, size is on the vertical axis and performance ( Pfmn) is on the horizontal axis. Table 4 Beginning Segment Growth Rates Traditional 9.2% Low End 11.7% High End 16.2% Performance 19.8% Size 18.3% 3 Buying Criteria By Segment These are your products and the primary segments they sell into at the beginning of the simulation. These ca decisions and as the simulation evolves. Able Traditional Acre Low End Adam High End Aft Performance Agape Size Table 3 Ideal Spot Offsets: Customers prefer products located this distance from the center of the segment circle. AR Lag (days) (1): 30 AP Lag (days) (1) : 30 help needed please
Step by Step Solution
There are 3 Steps involved in it
Step: 1

Get Instant Access to Expert-Tailored Solutions
See step-by-step solutions with expert insights and AI powered tools for academic success
Step: 2

Step: 3
Ace Your Homework with AI
Get the answers you need in no time with our AI-driven, step-by-step assistance
Get Started
Cost Accounting A Managerial Emphasis
Authors: Charles T. Horngren, Srikant M.Dater, George Foster, Madhav
14th Edition
978-0132960649, 132960648, 132109174, 978-0132109178