

Answered step by step
Verified Expert Solution
Question
1 Approved Answer
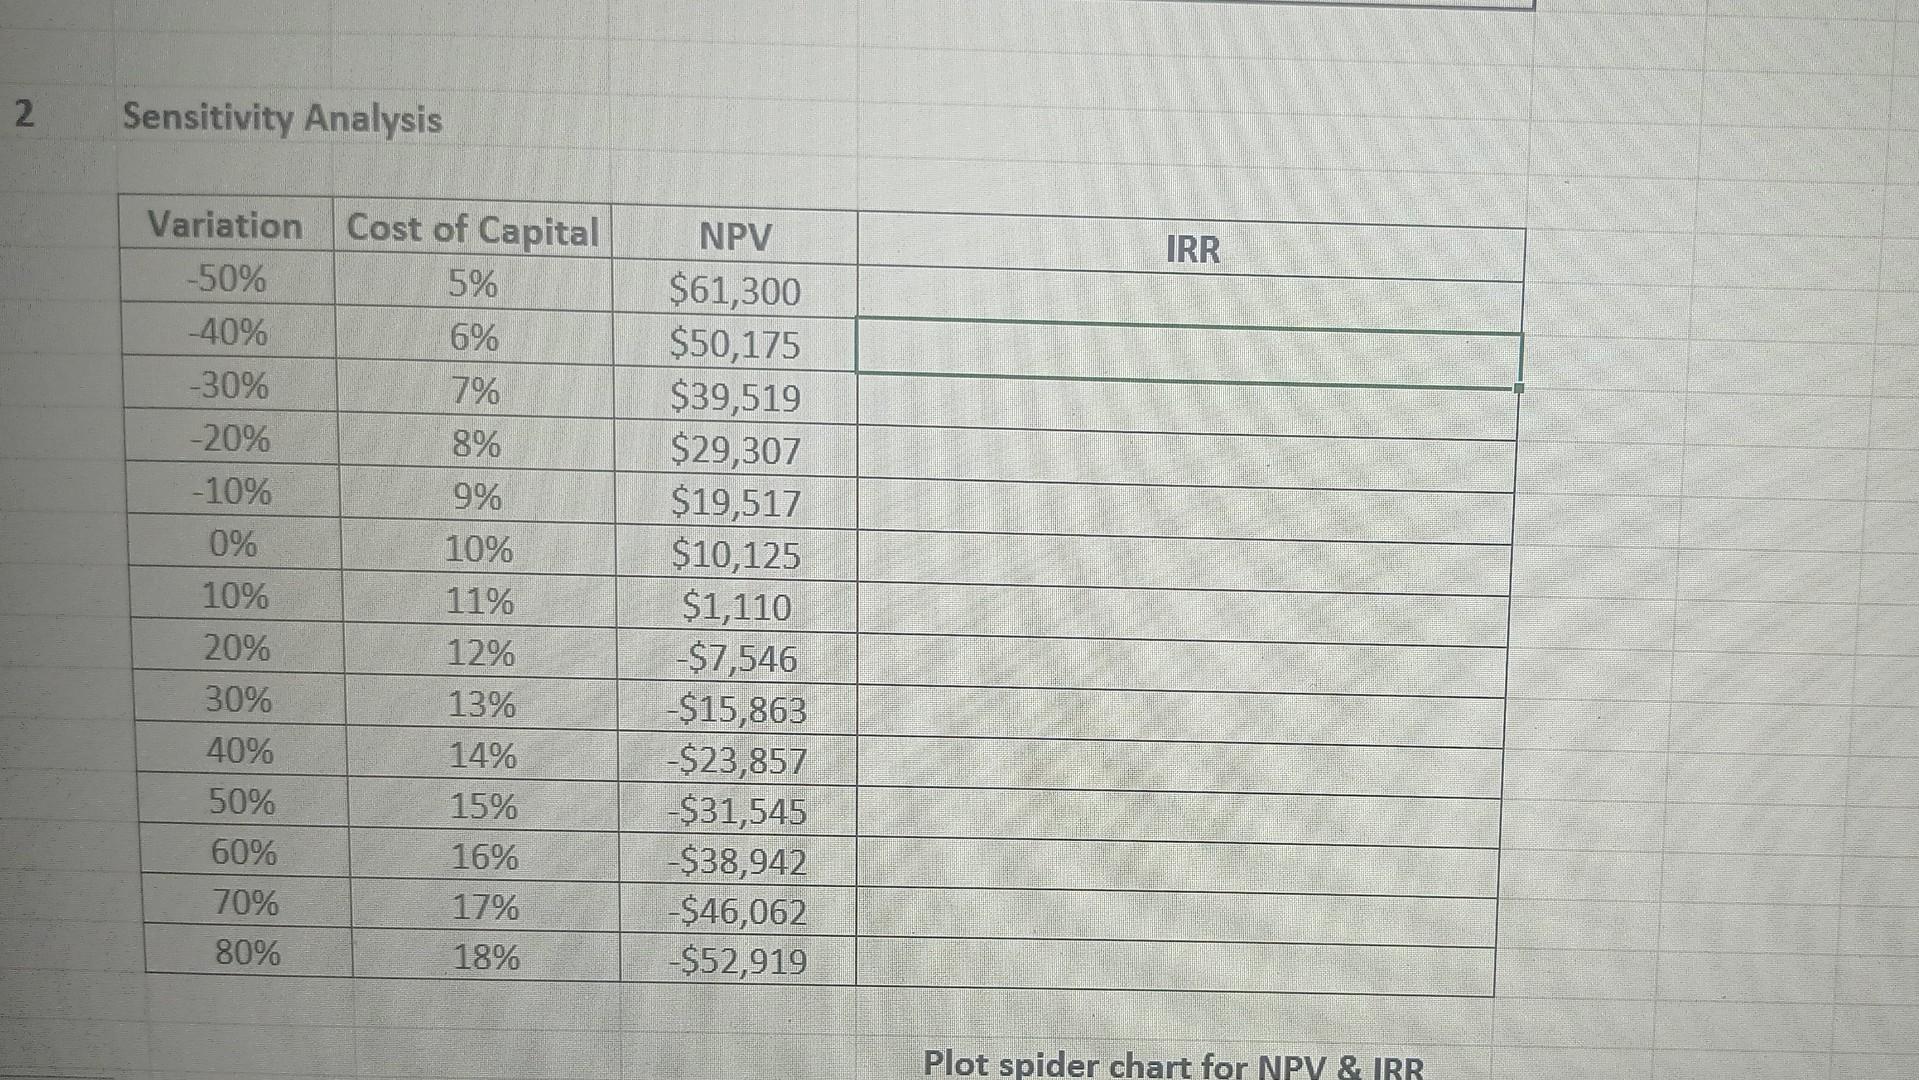
carryout a sensitivity analysis and plot a spider chart with the cost of capital varying from 5% to 18% for both the NPV and IRR
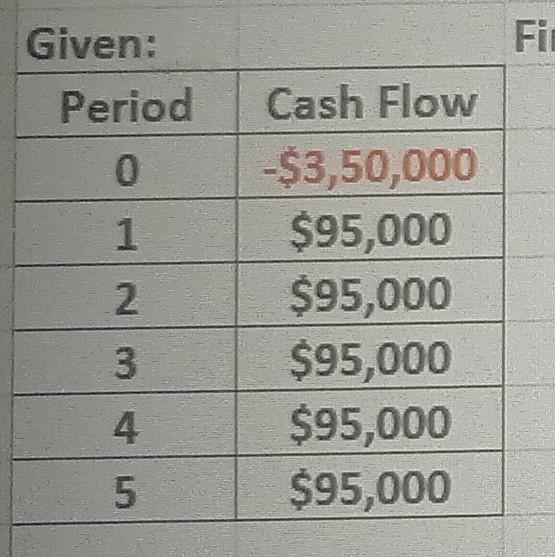
carryout a sensitivity analysis and plot a spider chart with the cost of capital varying from 5% to 18% for both the NPV and IRR
find IRR
\begin{tabular}{|c|c|} \hline Given: & \\ \hline Period & Cash Flow \\ \hline 0 & $3,50,000 \\ \hline 1 & $95,000 \\ \hline 2 & $95,000 \\ \hline 3 & $95,000 \\ \hline 4 & $95,000 \\ \hline 5 & $95,000 \\ \hline \end{tabular} 2 Sensitivity AnalysisStep by Step Solution
There are 3 Steps involved in it
Step: 1

Get Instant Access to Expert-Tailored Solutions
See step-by-step solutions with expert insights and AI powered tools for academic success
Step: 2

Step: 3
Ace Your Homework with AI
Get the answers you need in no time with our AI-driven, step-by-step assistance
Get Started
Global Finance At Risk
Authors: S. Sen
1st Edition
1349420492, 978-1349420490