Answered step by step
Verified Expert Solution
Question
1 Approved Answer
Case 1: Introducing the Cyan Card at University of BlueGreen University of BlueGreen (UofBG) is a mid-sized university located somewhere in the Midwest. Students

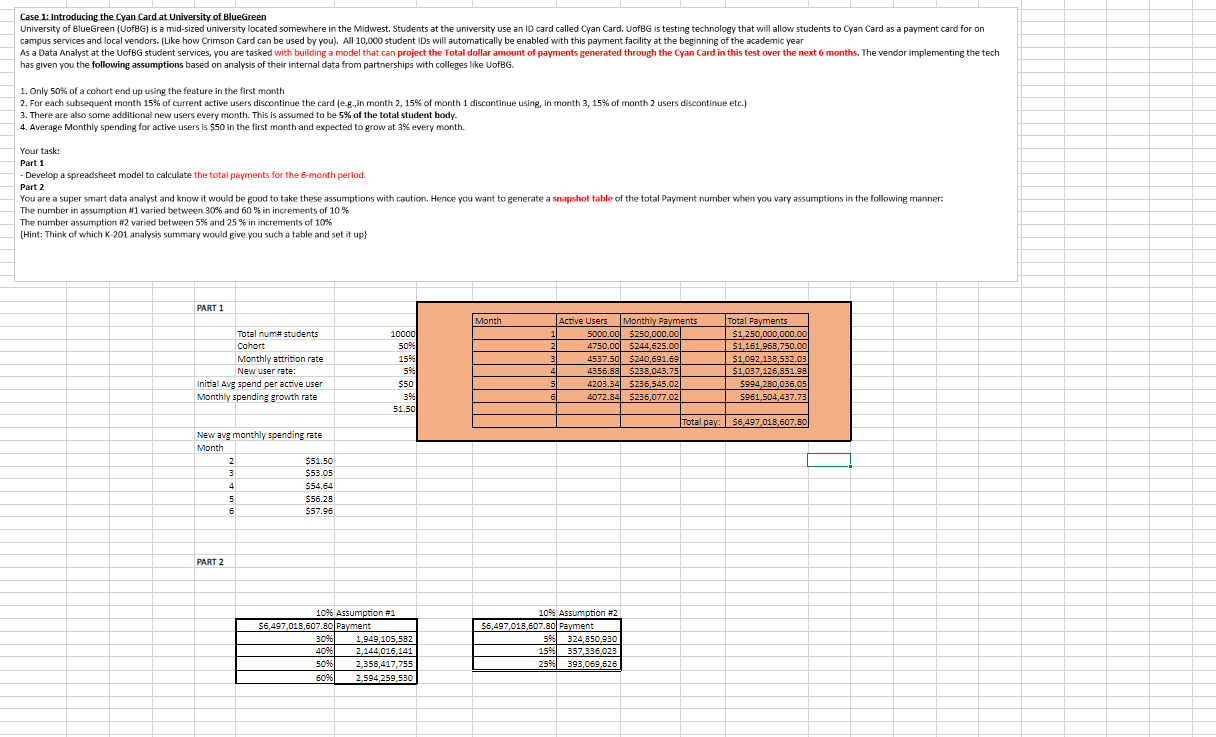
Case 1: Introducing the Cyan Card at University of BlueGreen University of BlueGreen (UofBG) is a mid-sized university located somewhere in the Midwest. Students at the university use an ID card called Cyan Card. UofBG is testing technology that will allow students to Cyan Card as a payment card for on campus services and local vendors. (Like how Crimson Card can be used by you). All 10,000 student IDs will automatically be enabled with this payment facility at the beginning of the academic year As a Data Analyst at the UofBG student services, you are tasked with building a model that can project the Total dollar amount of payments generated through the Cyan Card in this test over the next 6 months. The vendor implementing the tech has given you the following assumptions based on analysis of their internal data from partnerships with colleges like UofBG. 1. Only 50% of a cohort end up using the feature in the first month 2. For each subsequent month 15% of current active users discontinue the card (e.g.,in month 2, 15% of month 1 discontinue using, in month 3, 15% of month 2 users discontinue etc.) 3. There are also some additional new users every month. This is assumed to be 5% of the total student body. 4. Average Monthly spending for active users is $50 in the first month and expected to grow at 3% every month. Your task: Part 1 -Develop a spreadsheet model to calculate the total payments for the 6-month period. Part 2 You are a super smart data analyst and know it would be good to take these assumptions with caution. Hence you want to generate a snapshot table of the total Payment number when you vary assumptions in the following manner: The number in assumption #1 varied between 30% and 60% in increments of 10% The number assumption #2 varied between 5% and 25% in increments of 10% (Hint: Think of which K-201 analysis summary would give you such a table and set it up} PART 1 Month Active Users Monthly Payments Total Payments Total num# students Cohort 10000 1 5000.00 $250,000.00 $1,250,000,000.00 50% 2 4750.00 $244,625.00 $1,161,968,750.00 Monthly attrition rate New user rate: 15% 3 4537.50 $240,691.69 $1,092,138,532.03 596 4 4356.88 $238,043.75 $1,037,126,851.98 Initial Avg spend per active user Monthly spending growth rate $50 4203.34 $236,545.02 6 4072.84 $236,077.02 51.50 $994,280,036.05 5961,504,437.73 Total pay: $6,497,018,607.80 New avg monthly spending rate Month 2 $51.50 $53.05 4 $54.64 5 $56.28 6 $57.96 PART 2 10% Assumption #1 $6,497,018,607.80 Payment 10% Assumption #2 $6,497,018,607.80 Payment 30% 1,949,105,582 40% 2,144,016,141 50% 2,358,417,755 59 324,850,930 15% 357,336,023 259 393,069,626 60% 2,594,259,530
Step by Step Solution
There are 3 Steps involved in it
Step: 1

Get Instant Access to Expert-Tailored Solutions
See step-by-step solutions with expert insights and AI powered tools for academic success
Step: 2

Step: 3

Ace Your Homework with AI
Get the answers you need in no time with our AI-driven, step-by-step assistance
Get Started


