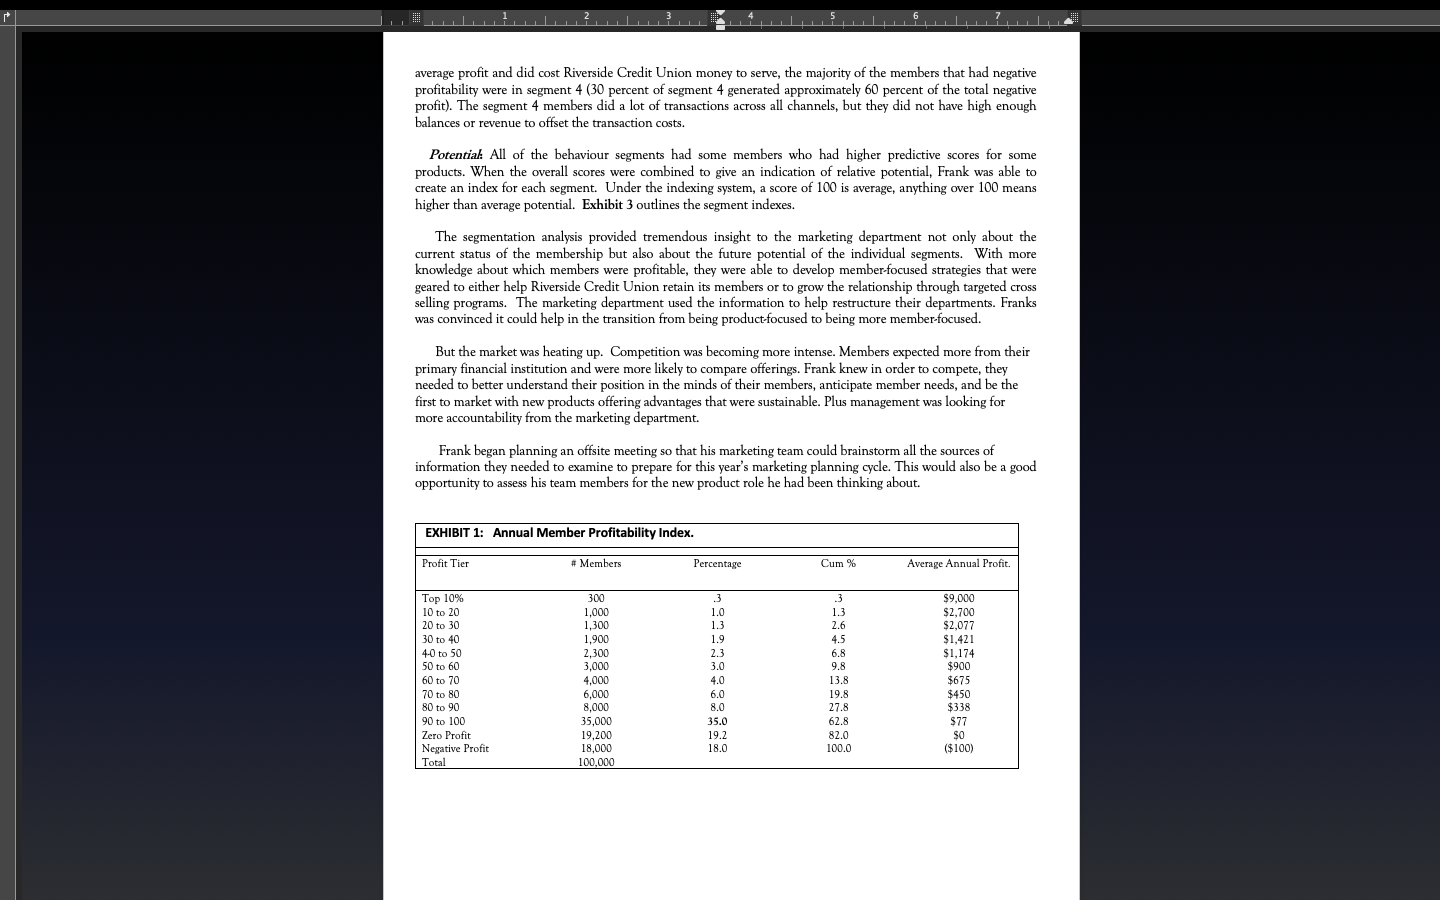
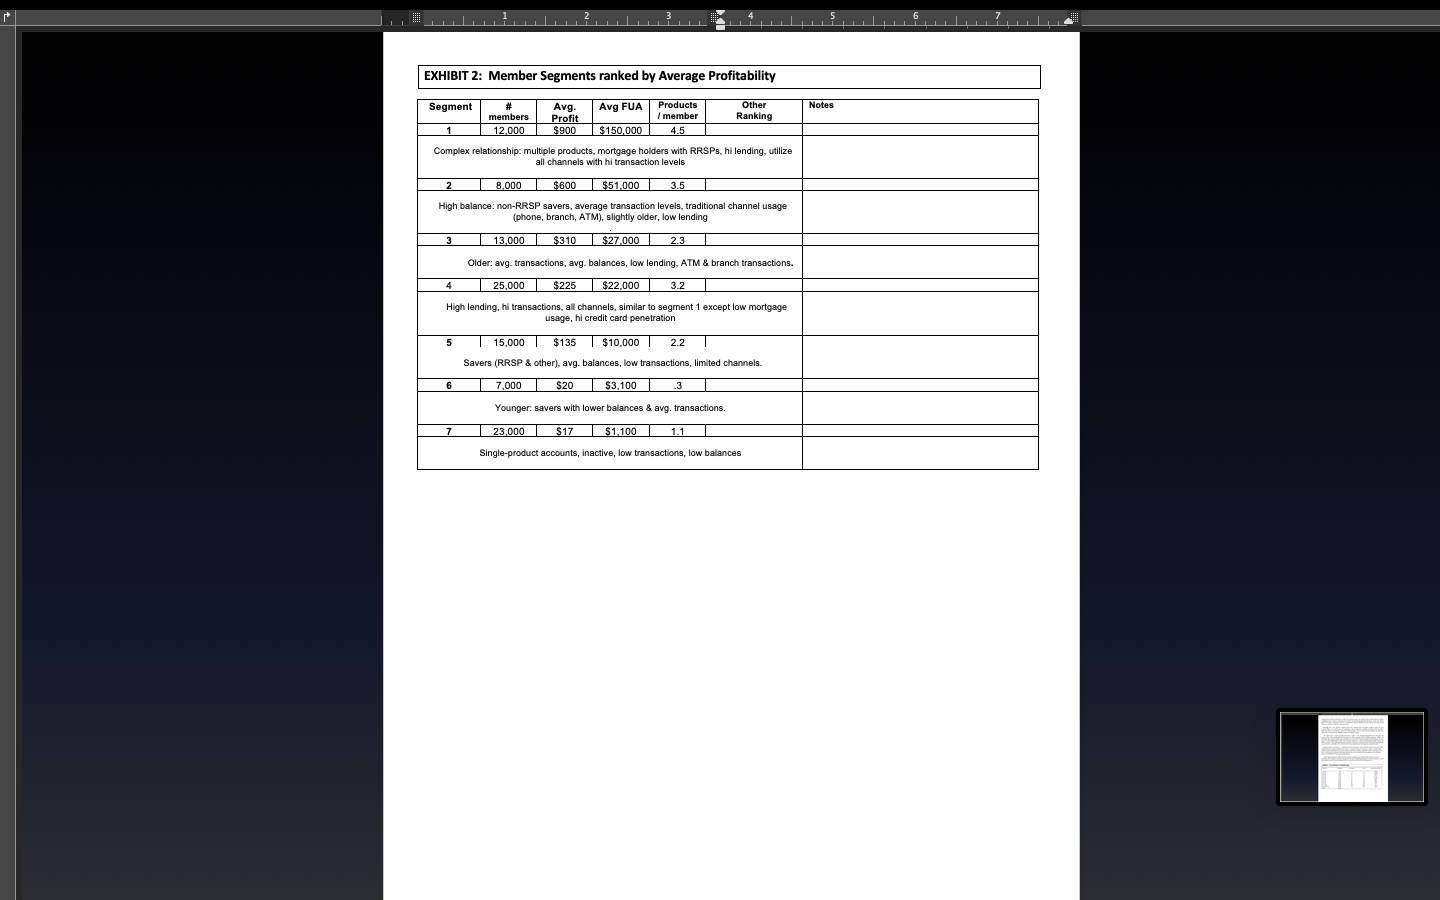
Case #1: Riverside Credit Union Riverside Credit Union Jeff Schulz and Pezzy Cunningham Frank Timmerman, Vice-President of Marketing at Riverside Credit Union, sat at his desk with a smile on his face. After months of effort, he believed he now really had a handle on Riverside Credit Union's membership. He had been in charge of the initiative to segment the membership base to see if he could better understand how different members contributed to the profitability of the credit union. He also wanted to know which members he should concentrate on in terms of building their business to ensure future profitability. He believed having a better understanding of the various segment profiles would also help his Credit Union better target appropriate financial products to members. BACKGROUND Riverside Credit Union is a well-established credit union with just over 100,000 retail members and a small but rapidly growing business membership of about 10,000 members. Credit unions are similar to banks in many respects, but they also have a number of key differences. Like banks, they offer many financial services - everything from savings and chequing accounts to investment advice. However, unlike banks, credit unions don't have customers - they have members. The members are the actual owners of the credit union. Furthermore, credit inions have a strong sense of their social responsibility in addition to their financial responsibility. Riverside Credit Union, for example, describes itself as a democratic, ethical, and innovative provider of financial services to its members. It is committed to doing business not only in a way that strengthens its own long- term success but also in a manner that contributes to the social, economic, and environmental well-being of the community in which it operates. Riverside Credit Union has been quite successful and has assets under administration of almost $2.5 billion. Much of its success is due to its excellent member service culture, the regular introduction of new competitive products, and an aggressive pricing policy that ensures members are always getting some of the best rates available. Riverside Credit Union also has a good distribution network with which to serve its members. It has 15 branches, 30 ATMs, PC banking, a call centre that is mostly dedicated to serving members, and an interactive voice-response phone banking system. It also has a number of mortgage development managers. During the past two years, the branch sales force had been realigned to focus more on relationship selling. The salesforce has placed the greatest emphasis on members with high balances. Riverside Credit Union is located in a large urban area that has until recently been growing a little faster than the rest of the country. During the last year or so the economy has been slowing, resulting in much more competition among financial institutions. There is also more competition from category killers that are focusing on specific product areas like credit cards and mortgages. The Internet has facilitated this type of banking and that done by other 'direct' financial institutions, which are aggressively competing for savings and investment accounts, with rates approaching term-deposit levels. Continuing pressure on margin has made it impossible for Riverside Credit Union to maintain its aggressive pricing policy, and as such it has seen some erosion of its core business. Riverside Credit Union has long prided itself on having a strong product marketing group. Frank Timmerman was a member of this group. One of the tools that has been invaluable to the marketing group has been the member database information system (MDIS). This database captured all of the product information (except the off-balance mutual fund business). Frank knew that although there had been a lot of member analysis and research, most of it revolved around specific products. Little was known about the full value or nature of the relationships Riverside Credit Union had with its membership. Thus, under Frank's leadership a new project was launched so that the marketing department could deepen its understanding of the membership. Frank thought it was critical that Riverside Credit Union be able to anticipateits members' needs and to build long-term relationships with the members. The information currently available in the database wasn't up to this task. Therefore, a detailed segmentation analysis was conducted of the entire retail membership. The marketing team hired an expert in segmentation to assist in the work. When the project stated, no one knew what the results should show. SEGMENTATION APPROACH Frank believed that getting this type of information was a pressing need given the growing competition in the marketplace. Since he had only a short time frame within which to complete the initial study, he decided to use only the data currently available in the MDIS for the analysis. Any external data he might want, or external research he might conduct later, could be added once he had a firmer understanding of the various member segments. Frank and the team felt that information like share of wallet would be too difficult to get for the entire membership, or would be too inaccurate to be useful. Frank and the team decided there were three things they most needed to know about the membership: (1) profitability of the relationships, (2) behaviour of the members with regard to their usage of various Riverside Credit Union products and services, and (3) future potential. Details on each of these dimensions and the data that were used in the analysis are outlined below. Profitability was examined by summing the margin, fee, and service charge revenue for each member and then subtracting the expenses. With the assistance of Accounting, the total cost for each transaction type was identified and then divided by the total number of transactions to generate a per-transaction cost. With input from Sales and Branch Operations, setup and maintenance costs were also determined. Expenses were subtracted from revenues to calculate profitability for each member. Even though there were a few missing numbers, the team agreed that the calculation would represent the relative profitability of one member versus another. Profitability would be looked at by value and by decile to understand the dynamics of the membership. Member behaviour, or the type of financial relationship the person had with Riverside credit Union, was the next variable to be analyzed. To understand this, Riverside compiled all of the data it had for each member for the past year. These included transactional data, member age, their account information, information on what channel they used, length of their membership, and so on. A clustering technique was used to group members so that those who demonstrated similar "behaviour" were grouped together while keeping the groups as distinct as possible from the other groups. To assess potential, predictive models were developed for the core products offered by Riverside Credit Union (RRPS, mortgages, term deposits, loans, credit cards and lines of credit, etc.). These models were created using statistical techniques (such as regression). The models were formulated using data from members who had previously purchased the product. The models can then be used to predict future sales of that particular product. Riverside Credit Union had used predictive models successfully in the past to target product campaigns, and it was pretty comfortable with their use. Each member would be scored for each product. This information was then added to the analysis. SEGMENTATION RESULTS Profitability: Exhibit 1 summarized the annual member profitability. Behaviour segments. Seven different member segments emerged from the analysis. They are described in Exhibit 2 in order of average profitability. Each segment profile also includes a description of average funds under administration (FUA) and average products per member. Frank conducted some further analysis that quickly showed that although segments 6 and 7 had the lowestaverage profit and did cost Riverside Credit Union money to serve, the majority of the members that had negative profitability were in segment 4 (30 percent of segment 4 generated approximately 60 percent of the total negative profit). The segment 4 members did a lot of transactions across all channels, but they did not have high enough balances or revenue to offset the transaction costs. Potential. All of the behaviour segments had some members who had higher predictive scores for some products. When the overall scores were combined to give an indication of relative potential, Frank was able to create an index for each segment. Under the indexing system, a score of 100 is average, anything over 100 means higher than average potential. Exhibit 3 outlines the segment indexes. The segmentation analysis provided tremendous insight to the marketing department not only about the current status of the membership but also about the future potential of the individual segments. With more knowledge about which members were profitable, they were able to develop member-focused strategies that were geared to either help Riverside Credit Union retain its members or to grow the relationship through targeted cross selling programs. The marketing department used the information to help restructure their departments. Franks was convinced it could help in the transition from being product-focused to being more member-focused. But the market was heating up. Competition was becoming more intense. Members expected more from their primary financial institution and were more likely to compare offerings. Frank knew in order to compete, they needed to better understand their position in the minds of their members, anticipate member needs, and be the first to market with new products offering advantages that were sustainable. Plus management was looking for more accountability from the marketing department. Frank began planning an offsite meeting so that his marketing team could brainstorm all the sources of information they needed to examine to prepare for this year's marketing planning cycle. This would also be a good opportunity to assess his team members for the new product role he had been thinking about. EXHIBIT 1: Annual Member Profitability Index. Profit Tier # Members Percentage Cum Average Annual Profit. Top 10% 300 $9,000 10 to 20 1,000 1.0 1.3 $2,700 20 to 30 1,300 1.3 2.6 $2,077 30 to 40 1,900 1.9 4.5 $1,421 4-0 to 50 2,300 2.3 6.8 $1,174 50 to 60 3,000 3.0 9.8 $900 60 to 70 4.000 4.0 13.8 $675 70 to 80 6,000 6.0 19.8 $450 80 to 90 8,000 8.0 27.8 $338 90 to 10 35,000 35.0 62.8 $77 Zero Profit 19,200 19.2 82.0 SO Negative Profit 18,000 18.0 100.0 ($100) Total 100,000EXHIBIT 2: Member Segments ranked by Average Profitability Segment # Avg. Avg FUA | Products Other members Notes Profit member Ranking 12,000 $900 $150,000 45 Complex relationship: multiple products, mortgage holders with RRSPs, hi lending, utilize all channels with hi transaction levels 8,000 $600 $51.000 3.5 High balance: non-RRSP savers, average transaction levels, traditional channel usage (phone, branch, ATM), slightly older, low lending 13,000 0 $27.000 2.3 Older: avg. transactions, avg. balances, low lending, ATM & branch transactions. 25,000 $225 $22,000 3.2 High lending, hi transactions, all channels, similar to segment 1 except low mortgage usage, hi credit card penetration 5 15,000 $135 $10.000 2.2 Savers (RRSP & other), avg. balances, low transactions, limited channels. 6 7,000 $20 $3.100 Younger: savers with lower balances & avg. transactions 23,000 $17 $1.100 Single-product accounts, inactive, low transactions, low balancesRIVERSIDE CREDIT UNION CASE ANALYSIS EXHIBIT 3 Segment Index NOTES Segment Descriptors Seg. Potential High Potential Products #1 Index W N 125 Mortgage, RRSP, LOC, Credit Card #2 150 Terms, RRSP #3 140 RRSP, Term #4 200 RRSP, Mortgage, Credit Card, Loans 5 100 RRSP, Mortgage, Credit Card #5 6 55 40 Term #6 Low on Most, Some Credit Card #7 Other Priority Criteria Notes 1 Priority Products By Segment 2 #1 3 #2 #3 #4 EXHIBIT 4: Summary & Additional Segmentation Analysis: # members or population, FUA*, profitability, potential index, NPS, SOW, tenure (yrs), avg age, product profile... Seg. Pot. Average Total % Of Total members Index FUA Avg FUA $Million) total profit assets Profit %% of of total tot $Million) profits profits 0 0 m D' S 12,000 125 $150,000 $1,800 54.45% $900 $10.80 38.83% 39% 4+ 8.090 150 $51,000 $408 12.3470 $600 $4.80 17.260 50 70 13,000 140 $351 25,000 200 $27,000 11.62% $310 16.64% SECS $4.03 70% $550 $5.62 14.29% $22,000 20.23% 91% 15,000 100 $10,000 $150 4.54% $135 $2.02 7.28% 98% 7.000 55 $3.100 $21 .66% $20 50.14 0.50% 99% 23,000 40 $1,100 $25 .77% $17 $0.39 1.41% 100% Total 103,000 n/a n/a $3,306 100.00% n/a Other 10,000 $27.81 100% CUM * FUA: Funds Under Administration) CUM: Cumulative NPS: Net Promoter Score SOW: Share of Wallet CR: credit rating File: Riverside Credit Union with Work Sheet LB Rev Mar 2018 5 pages VERT SOURCE: Contemporary Canadian Marketing Cases, HR Herb MackenzieRiverside Credit Union - Introductory case study questions Assignment A Assignment B 1. If your share of market (SOM) is +50%, you would 1. If your share of market (SOM) was under 10%, how want to insulate (retain) your SOM. Which 2 segments would you build SOM (attract competitor customers). are most at risk related to current profit? Explain. Which 2 segments have the most upside? Explain 2. Which current customers have most upside potential? 2. How much profit is at risk if you focus on share growth What IMC should you do? Any opportunity cost? Explain. rather than consolidation (grow vs insulate SOM)? Explain. 3. To get closer to current customers (KYC), what other 3. To get closer to the potential customers (KYC), what information could you useful to collect? Explain. ("Explain" means what info, how collected, why useful, how to other information could you useful to collect? Explain. ("Explain" means what info, how collected, why useful, how to use it and how to monitor the success of the action. use it and how to monitor the success of the action.) MARK 1027 RCU case and preliminary review A & B rev July 2019