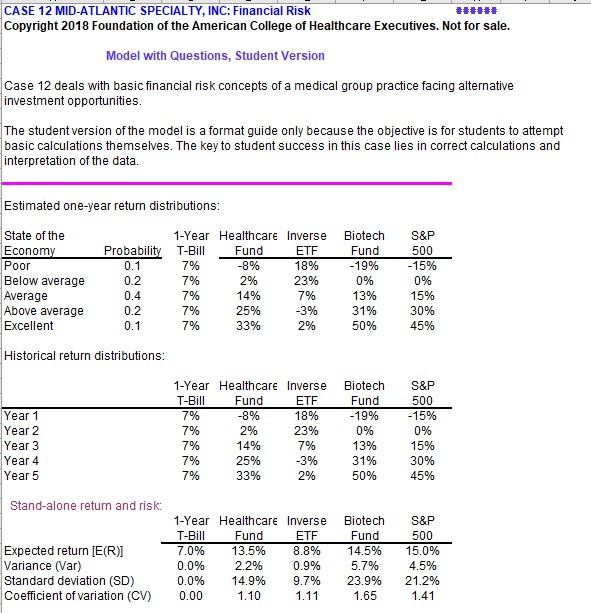
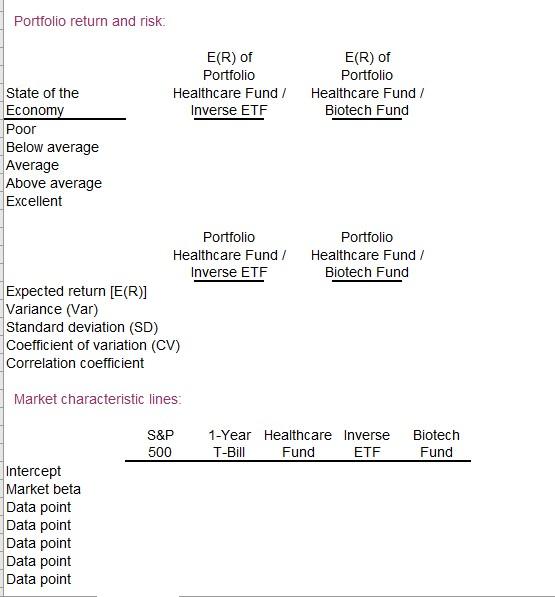
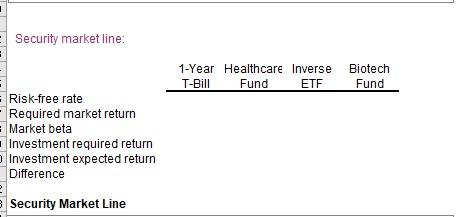
CASE 12 MID-ATLANTIC SPECIALTY, INC: Financial Risk ###### Copyright 2018 Foundation of the American College of Healthcare Executives. Not for sale. Model with Questions, Student Version Case 12 deals with basic financial risk concepts of a medical group practice facing alternative investment opportunities. The student version of the model is a format guide only because the objective is for students to attempt basic calculations themselves. The key to student success in this case lies in correct calculations and interpretation of the data. Estimated one-year return distributions: State of the Economy Poor Below average Average Above average Excellent 1-Year Healthcare Inverse Probability T-Bill Fund ETF 0.1 7% -8% 18% 0.2 7% 2% 23% 0.4 7% 14% 7% 0.2 7% 25% -3% 0.1 7% 33% 2% Biotech Fund -19% 0% 13% 31% 50% S&P 500 -15% 0% 15% 30% 45% Historical return distributions: 1-Year Healthcare Inverse T-Bill Fund ETF 7% -8% 18% 2% 23% 7% 14% 7% 7% 25% -3% 7% 33% 2% Year 1 Year 2 Year 3 Year 4 Year 5 7% Biotech Fund -19% 0% 13% 31% 50% S&P 500 -15% 0% 15% 30% 45% Stand-alone return and risk: Expected return [E(R)] Variance (Var) Standard deviation (SD) Coefficient of variation (CV) 1-Year Healthcare Inverse T-Bill Fund ETF 7.0% 13.5% 8.8% 0.0% 2.2% 0.9% 0.0% 14.9% 9.7% 0.00 1.10 1.11 Biotech Fund 14.5% 5.7% 23.9% 1.65 S&P 500 15.0% 4.5% 21.2% 1.41 Portfolio return and risk. State of the Economy E(R) of Portfolio Healthcare Fund / Inverse ETF E(R) of Portfolio Healthcare Fund / Biotech Fund Poor Below average Average Above average Excellent Portfolio Healthcare Fund / Biotech Fund Portfolio Healthcare Fund / Inverse ETF Expected return [E(R)] Variance (Var) Standard deviation (SD) Coefficient of variation (CV) Correlation coefficient Market characteristic lines: S&P 500 1-Year Healthcare Inverse T-Bill Fund ETF Biotech Fund Intercept Market beta Data point Data point Data point Data point Data point 1 - Security market line: 1-Year Healthcare Inverse Biotech T-Bill Fund ETF Fund . Risk-free rate Required market return Market beta Investment required return Investment expected return Difference Security Market Line CASE 12 MID-ATLANTIC SPECIALTY, INC: Financial Risk ###### Copyright 2018 Foundation of the American College of Healthcare Executives. Not for sale. Model with Questions, Student Version Case 12 deals with basic financial risk concepts of a medical group practice facing alternative investment opportunities. The student version of the model is a format guide only because the objective is for students to attempt basic calculations themselves. The key to student success in this case lies in correct calculations and interpretation of the data. Estimated one-year return distributions: State of the Economy Poor Below average Average Above average Excellent 1-Year Healthcare Inverse Probability T-Bill Fund ETF 0.1 7% -8% 18% 0.2 7% 2% 23% 0.4 7% 14% 7% 0.2 7% 25% -3% 0.1 7% 33% 2% Biotech Fund -19% 0% 13% 31% 50% S&P 500 -15% 0% 15% 30% 45% Historical return distributions: 1-Year Healthcare Inverse T-Bill Fund ETF 7% -8% 18% 2% 23% 7% 14% 7% 7% 25% -3% 7% 33% 2% Year 1 Year 2 Year 3 Year 4 Year 5 7% Biotech Fund -19% 0% 13% 31% 50% S&P 500 -15% 0% 15% 30% 45% Stand-alone return and risk: Expected return [E(R)] Variance (Var) Standard deviation (SD) Coefficient of variation (CV) 1-Year Healthcare Inverse T-Bill Fund ETF 7.0% 13.5% 8.8% 0.0% 2.2% 0.9% 0.0% 14.9% 9.7% 0.00 1.10 1.11 Biotech Fund 14.5% 5.7% 23.9% 1.65 S&P 500 15.0% 4.5% 21.2% 1.41 Portfolio return and risk. State of the Economy E(R) of Portfolio Healthcare Fund / Inverse ETF E(R) of Portfolio Healthcare Fund / Biotech Fund Poor Below average Average Above average Excellent Portfolio Healthcare Fund / Biotech Fund Portfolio Healthcare Fund / Inverse ETF Expected return [E(R)] Variance (Var) Standard deviation (SD) Coefficient of variation (CV) Correlation coefficient Market characteristic lines: S&P 500 1-Year Healthcare Inverse T-Bill Fund ETF Biotech Fund Intercept Market beta Data point Data point Data point Data point Data point 1 - Security market line: 1-Year Healthcare Inverse Biotech T-Bill Fund ETF Fund . Risk-free rate Required market return Market beta Investment required return Investment expected return Difference Security Market Line