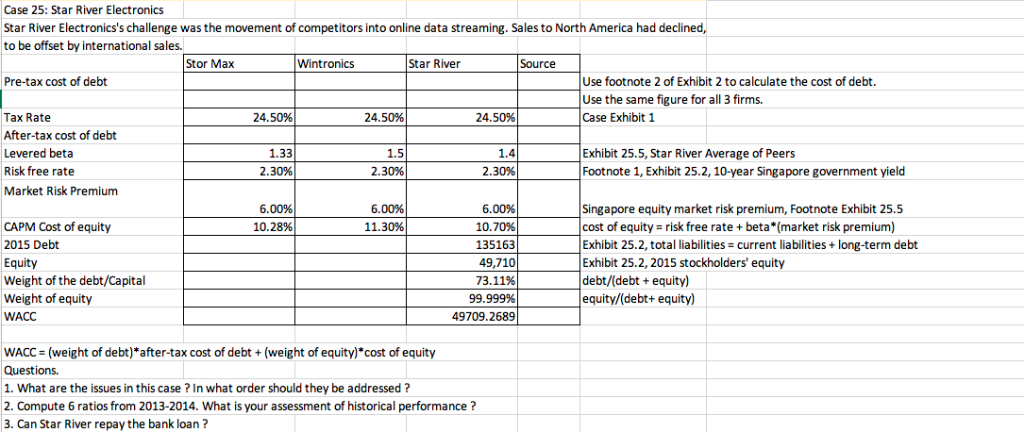
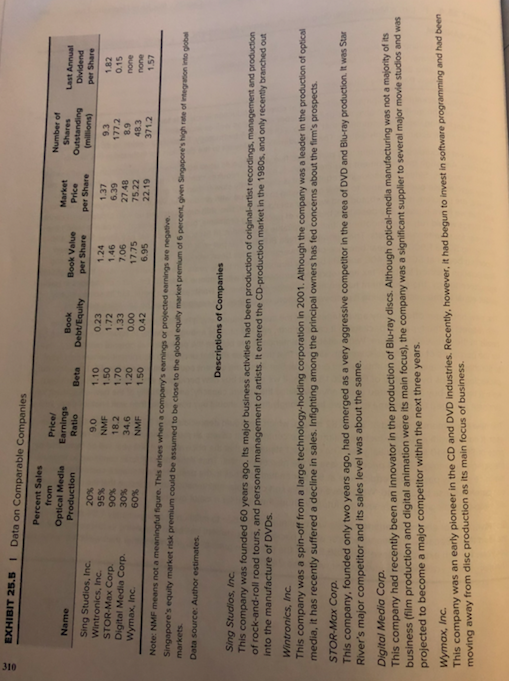
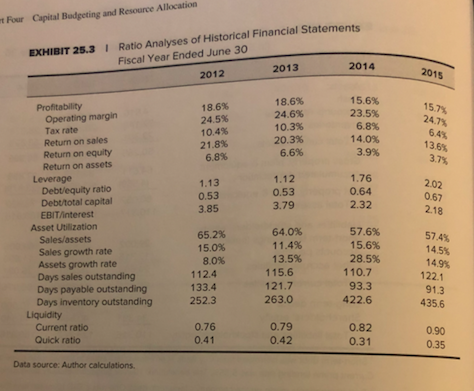
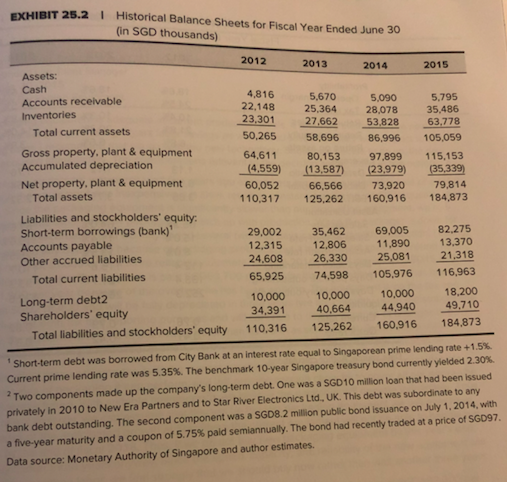
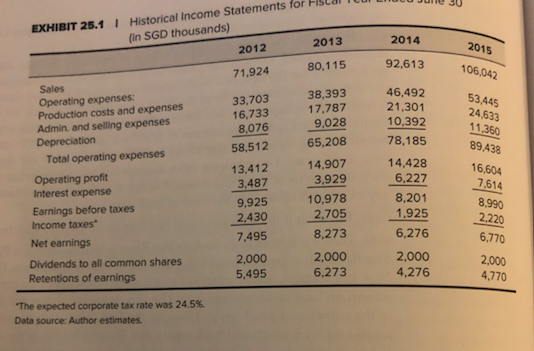
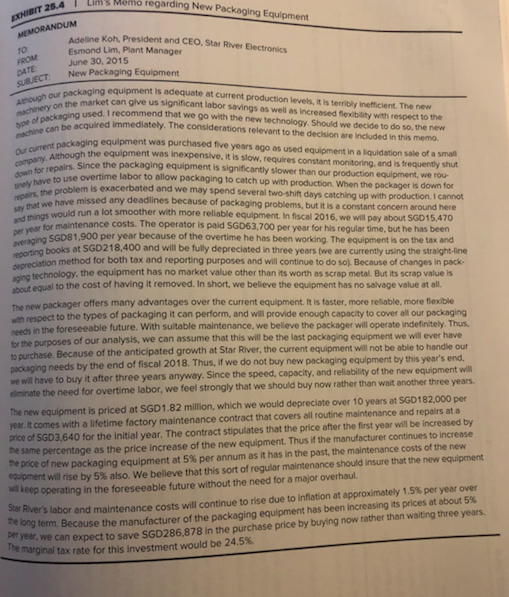
Case 25: Star River Electronics Star River Electronics's challenge was the movement of competitors into online data streaming. Sales to North America had declined, to be offset by international sales. Stor Max Wintronics Star River Source Pre-tax cost of debt Use footnote 2 of Exhibit 2 to calculate the cost of debt. Use the same figure for all 3 firms. Case Exhibit 1 Tax Rate After-tax cost of debt Levered beta Risk free rate Market Risk Premium 24.50% 24.50% 24.50% 1.5 2.30% Exhibit 25.5, Star River Average of Peers Footnote 1, Exhibit 25.2, 10-year Singapore government yield 1.33 2.30% 2.30% 6.00% 6.00% 11.30% CAPM Cost of equity 2015 Debt Equity Weight of the debt/Capital Weight of equity WACC 6.00% 10.70% 135163 49,710 73.11% 99.999% 49709.2689 Singapore equity market risk premium, Footnote Exhibit 25.5 cost of equity risk free rate+beta (market risk premium) Exhibit 25.2, total liabilities current liabilities+long-term debt Exhibit 25.2, 2015 stockholders' equity debt/(debt +equity) equity/(debt+ equity) 10.28% WACC (weight of debt)*after-tax cost of debt+(weight of equity)*cost of equity Questions. 1. What are the issues in this case? In what order should they be addressed? 2. Compute 6 ratios from 2013-2014. What is your assessment of historical performance? 3. Can Star River repay the bank loan? EXHIBIT 25.5I Data on Comparable Companies Percent Sales Price/ Number of Optical Media Earnings Market Last Annual Book Value Price OutstandingDividend (miltions)Dividend Sing Studios, Inc. Wintronics, Inc. STOR-Max Corp Digital Media Corp. Wymax, Inc 20% 95% 90% 30% 60% 9.0 NMF 1.10 1.50 1.70 1.20 1.50 0.23 1.72 1.33 0.00 0.42 1.37 6.39 27.48 75.22 22.19 1.82 0.15 1.46 7.06 17.75 6.95 18.2 34.6 48.3 371.2 Singapore's equity market risk premium could be assumed to be close to the global equlity market premium of 6 percent,gven Singapore's high rate of interation n markets gob Data source: Author estimates Sing Studios, Inc This company was founded 60 years ago. ts major business activities had been production of original-artist recordings, management and f rock-and-roll road tours, and personal management of artists. It entered the CD-production market in the 1980s, and only recently branched out into the manufacture of DVDs Wintronics, Inc This company was a spin-off from a large technology-holding corporation in 2001. Although the company was a leader in the production of optical media, it has recently suffered a decline in sales. Infighting among the principal owners has fed concerns about the firm's prospects STOR-Max Corp This company, founded only two years ago, had emerged as a very aggressive competitor in the area of DVD and Blu-ray production t was Sta River's major competitor and its sales level was about the same. Digital Media Corp This company had recently been an innovator in the production of Blu-ray discs. Although optical-media manufecturing was not a majority of ts business (ilm production and digital animation were its main focus), the company was a significant supplier to several major movie studios and was projected to become a major competitor within the next three years. Wymax, Inc This company was an early pioneer in the CD and DVD industries. Recently, however, it had begun to invest in software pr moving away from disc production as its main focus of business t Four Capital Budgeting and Resource Allocation Ratio Analyses of Historical Financial Statements Fiscal Year Ended June 30 EXHIBIT 25.3 I 2012 2013 2014 2015 15. 6 3. Profitability 18.6% 18.6% Operating margin 24.5% 24.6% Tax rate 10.3% 20.3% Return on sales 10.4% 21.8% Return on equity 6.8% 6.6% Return on assets Leverage 1.13 0.53 3.85 1.12 0.53 3.79 Debt/equity ratio 1.76 0.64 2.02 0.67 18 Debt/total capital EBIT/interest Asset Utillization Sales/assets Sales growth rate Assets growth rate Days sales outstanding Days payable outstanding Days inventory outstanding 65.2% 15.0% 8.0% 64.0% 11.4% 13.5% 57.6% 28.5% 93.3 14.5% 112.4 133.4 252.3 115.6 121.7 263.0 Current ratio Quick ratio 0.76 0.82 0.31 0.42 Data source: Author calculations. EXHIBIT 25.2 I Historical Balance Sheets for Fiscal Year Ended June 30 (in SGD thousands) 2012 2013 2014 2015 Assets: Cash Accounts receivable Inventories 4,816 5,670 5,090 5.799 35,486 27.662 5382863.178 50265 58,696 8 105.059 22.148 25,364 28,078 Total current assets Gross property, plant & equipment Accumulated depreciation Net property, plant & equipment 58,696 86.996 86,996 64,61180,153 97.899 115,153 (4.559) 13,587)23,979)35.339) 60,05266,566 73,920 79,814 Total assets 110,317 125.262 160,916 184,873 Liabilities and stockholders' equity Short-term borrowings (bank) Accounts payable Other accrued liabilities 69,005 82,275 29,002 12.315 12.806 11,890 13,370 24.608 26.330 25.081 21.318 65.925 74,598 105,976 116,963 35,462 Total current liabilities Long-term debt2 Shareholders equity 10,000 10,000 10,000 18,200 34,391 40.664 44940 49,710 Total liabilities and stockholders' equity 110,316 125.262 160.916 184,873 Short-term debt was borrowed from City Bank at an interest rate equal to Singaporean prime lending rate +1.5% Current prime lending rate was 5.35%. The benchmark 10-year Singapore treasury bond currently yielded 2.30%. 2Two components made up the company's long-term debt. One was a SGD10 million loan that had been issued privately in 2010 to New Era Partners and to Star River Electronics Ltd., UK. This debt was subordinate to any bank debt outstanding. The second component was a SGD8.2 million public bond issuance on July 1,2014, with a five-year maturity and a coupon of 5.75% paid semiannually. The bond had recently traded at a price of SS097 Data source: Monetary Authority of Singapore and author estimates EXHIBIT 25.11 Historical Income Statements for Fista (in SGD thousands) 2013 2014 2012 2015 106 71,924 80,115 92,613 Sales Operating expenses: 33,703 16,733 8,076 58,512 38,393 17,787 9,028 65,208 46,492 21,301 10,392 78,185 Production costs and expenses Admin. and selling expenses 24,633 Depreciation Total operating expenses Operating profit 14,907 3,929 10,978 14,428 6,227 8,201 13.412 16 604 7.61 8,990 Interest expense 3.487 Earnings before taxes 9,925 2.430 2.705 1925 2220 Income taxes Net earnings Dividends to all common shares 7,495 2,000 5,495 8,273 6,276 6,770 2,000 6,273 2,000 4,276 2,000 4,770 Retentions of earnings The expected corporate tax rate was 24.5%. Data source: Author estimates. s Memo regarding New Packaging Equipment Adeline Koh, President and CEO, Star River Electronics Esmond Lim, Plant Mana June 30, 2015 New Packaging Equipment ackaging equipment is adequate at current production levels, it is terribly inefficient. The new Our phe market can give us significant labor savings as well as Increased fesibility with respect to the chineying used. I recommend thet we go with the new technology. Should we decide to do so, the new exbe acquired immediately. The considerations relevant to the dechion are Included in this mema ng equipment was purchased five years ago as used equipment in a liquidation sale of a small cuent heh the equipment was inexpensive, it is slow, requires constant monitoring and is frequently shut nyeairs Since the packaging equipment is significantly slower than our production equipment, we rou- repairs, the problem say that we have missed any overtime labor to allow packaging to catch up with production When the packager is down for m is exacerbated and we may spend several two-shift days catching up with production. I cannot deadlines because of packaging problems, but it is a constant concern becau around here y things would run a lot smoother with more reliable equipment. In fiscal 2016, we will pay about SGD15,470 p y SGD81.900 per year becouse of the overtime he has been working. The equipment is on the tax and cegreciation method for both tax and reporting purposes and will continue to do so). Because of changes in pack maintenance costs. The operator is paid SGD63,700 per year for his regular time, but he has been books at SGD218,400 and will be fully depreciated in three years (we are currently using the straight-ine aging technology, the bout equal to the cost of having it removed. In short, we believe the equipment has no salvage value at all. equipment has no market value other than its worth as scrap metal. But its scrap value is The new packager offers many advantages over the current equipment. It is faster, more rellable, more flexible with respect to the types of packaging it can perform, and will provide enough capacity to cover all our packaging the foreseeable future. With suitable maintenance, we believe the packager will operate indefinitely. Thus, needs in es of our analysis, we can assume that this will be the last packaging equipment we will ever have Because of the anticipated growth at Star River, the current equipment will not be able to handle our needs by the end of fiscal 2018. Thus, if we do not buy new packaging equipment by this years end. er three years anyway. Since the speed, capacity, and reliability of the new equipment will for overtime labor, we feel strongly that we should buy now rather than wait another three years have to buy it aft eliminate the need The new equipment is priced at SGD1.82 million, which we would depreciate over 10 years at SGD182.000 per year. It comes with a lifetime factory maintenance contract that covers all routine maintenance and repairs at a price of SGD3,640 for the initial year. The contract stipulates that the price after the first year will be increased by me percentage as the price increase of the new equipment. Thus if the manufacturer continues to increase price of new packaging equipment at 5% per annum as it has in the past, the maintenance costs of the new he sa eesment wil rise by 5% also, we believe that this sort of regular maintenance should insure that the new equipment Star per year, we keep operating in the foreseeable future without the need for a major overhaul. intenance costs will continue to rise due to inflation at approximately 1.5% per year over expect to save SGD286,878 in the purchase price by buying now rather than waiting three years ginal tax rate for this investment would be 24.5%. Case 25: Star River Electronics Star River Electronics's challenge was the movement of competitors into online data streaming. Sales to North America had declined, to be offset by international sales. Stor Max Wintronics Star River Source Pre-tax cost of debt Use footnote 2 of Exhibit 2 to calculate the cost of debt. Use the same figure for all 3 firms. Case Exhibit 1 Tax Rate After-tax cost of debt Levered beta Risk free rate Market Risk Premium 24.50% 24.50% 24.50% 1.5 2.30% Exhibit 25.5, Star River Average of Peers Footnote 1, Exhibit 25.2, 10-year Singapore government yield 1.33 2.30% 2.30% 6.00% 6.00% 11.30% CAPM Cost of equity 2015 Debt Equity Weight of the debt/Capital Weight of equity WACC 6.00% 10.70% 135163 49,710 73.11% 99.999% 49709.2689 Singapore equity market risk premium, Footnote Exhibit 25.5 cost of equity risk free rate+beta (market risk premium) Exhibit 25.2, total liabilities current liabilities+long-term debt Exhibit 25.2, 2015 stockholders' equity debt/(debt +equity) equity/(debt+ equity) 10.28% WACC (weight of debt)*after-tax cost of debt+(weight of equity)*cost of equity Questions. 1. What are the issues in this case? In what order should they be addressed? 2. Compute 6 ratios from 2013-2014. What is your assessment of historical performance? 3. Can Star River repay the bank loan? EXHIBIT 25.5I Data on Comparable Companies Percent Sales Price/ Number of Optical Media Earnings Market Last Annual Book Value Price OutstandingDividend (miltions)Dividend Sing Studios, Inc. Wintronics, Inc. STOR-Max Corp Digital Media Corp. Wymax, Inc 20% 95% 90% 30% 60% 9.0 NMF 1.10 1.50 1.70 1.20 1.50 0.23 1.72 1.33 0.00 0.42 1.37 6.39 27.48 75.22 22.19 1.82 0.15 1.46 7.06 17.75 6.95 18.2 34.6 48.3 371.2 Singapore's equity market risk premium could be assumed to be close to the global equlity market premium of 6 percent,gven Singapore's high rate of interation n markets gob Data source: Author estimates Sing Studios, Inc This company was founded 60 years ago. ts major business activities had been production of original-artist recordings, management and f rock-and-roll road tours, and personal management of artists. It entered the CD-production market in the 1980s, and only recently branched out into the manufacture of DVDs Wintronics, Inc This company was a spin-off from a large technology-holding corporation in 2001. Although the company was a leader in the production of optical media, it has recently suffered a decline in sales. Infighting among the principal owners has fed concerns about the firm's prospects STOR-Max Corp This company, founded only two years ago, had emerged as a very aggressive competitor in the area of DVD and Blu-ray production t was Sta River's major competitor and its sales level was about the same. Digital Media Corp This company had recently been an innovator in the production of Blu-ray discs. Although optical-media manufecturing was not a majority of ts business (ilm production and digital animation were its main focus), the company was a significant supplier to several major movie studios and was projected to become a major competitor within the next three years. Wymax, Inc This company was an early pioneer in the CD and DVD industries. Recently, however, it had begun to invest in software pr moving away from disc production as its main focus of business t Four Capital Budgeting and Resource Allocation Ratio Analyses of Historical Financial Statements Fiscal Year Ended June 30 EXHIBIT 25.3 I 2012 2013 2014 2015 15. 6 3. Profitability 18.6% 18.6% Operating margin 24.5% 24.6% Tax rate 10.3% 20.3% Return on sales 10.4% 21.8% Return on equity 6.8% 6.6% Return on assets Leverage 1.13 0.53 3.85 1.12 0.53 3.79 Debt/equity ratio 1.76 0.64 2.02 0.67 18 Debt/total capital EBIT/interest Asset Utillization Sales/assets Sales growth rate Assets growth rate Days sales outstanding Days payable outstanding Days inventory outstanding 65.2% 15.0% 8.0% 64.0% 11.4% 13.5% 57.6% 28.5% 93.3 14.5% 112.4 133.4 252.3 115.6 121.7 263.0 Current ratio Quick ratio 0.76 0.82 0.31 0.42 Data source: Author calculations. EXHIBIT 25.2 I Historical Balance Sheets for Fiscal Year Ended June 30 (in SGD thousands) 2012 2013 2014 2015 Assets: Cash Accounts receivable Inventories 4,816 5,670 5,090 5.799 35,486 27.662 5382863.178 50265 58,696 8 105.059 22.148 25,364 28,078 Total current assets Gross property, plant & equipment Accumulated depreciation Net property, plant & equipment 58,696 86.996 86,996 64,61180,153 97.899 115,153 (4.559) 13,587)23,979)35.339) 60,05266,566 73,920 79,814 Total assets 110,317 125.262 160,916 184,873 Liabilities and stockholders' equity Short-term borrowings (bank) Accounts payable Other accrued liabilities 69,005 82,275 29,002 12.315 12.806 11,890 13,370 24.608 26.330 25.081 21.318 65.925 74,598 105,976 116,963 35,462 Total current liabilities Long-term debt2 Shareholders equity 10,000 10,000 10,000 18,200 34,391 40.664 44940 49,710 Total liabilities and stockholders' equity 110,316 125.262 160.916 184,873 Short-term debt was borrowed from City Bank at an interest rate equal to Singaporean prime lending rate +1.5% Current prime lending rate was 5.35%. The benchmark 10-year Singapore treasury bond currently yielded 2.30%. 2Two components made up the company's long-term debt. One was a SGD10 million loan that had been issued privately in 2010 to New Era Partners and to Star River Electronics Ltd., UK. This debt was subordinate to any bank debt outstanding. The second component was a SGD8.2 million public bond issuance on July 1,2014, with a five-year maturity and a coupon of 5.75% paid semiannually. The bond had recently traded at a price of SS097 Data source: Monetary Authority of Singapore and author estimates EXHIBIT 25.11 Historical Income Statements for Fista (in SGD thousands) 2013 2014 2012 2015 106 71,924 80,115 92,613 Sales Operating expenses: 33,703 16,733 8,076 58,512 38,393 17,787 9,028 65,208 46,492 21,301 10,392 78,185 Production costs and expenses Admin. and selling expenses 24,633 Depreciation Total operating expenses Operating profit 14,907 3,929 10,978 14,428 6,227 8,201 13.412 16 604 7.61 8,990 Interest expense 3.487 Earnings before taxes 9,925 2.430 2.705 1925 2220 Income taxes Net earnings Dividends to all common shares 7,495 2,000 5,495 8,273 6,276 6,770 2,000 6,273 2,000 4,276 2,000 4,770 Retentions of earnings The expected corporate tax rate was 24.5%. Data source: Author estimates. s Memo regarding New Packaging Equipment Adeline Koh, President and CEO, Star River Electronics Esmond Lim, Plant Mana June 30, 2015 New Packaging Equipment ackaging equipment is adequate at current production levels, it is terribly inefficient. The new Our phe market can give us significant labor savings as well as Increased fesibility with respect to the chineying used. I recommend thet we go with the new technology. Should we decide to do so, the new exbe acquired immediately. The considerations relevant to the dechion are Included in this mema ng equipment was purchased five years ago as used equipment in a liquidation sale of a small cuent heh the equipment was inexpensive, it is slow, requires constant monitoring and is frequently shut nyeairs Since the packaging equipment is significantly slower than our production equipment, we rou- repairs, the problem say that we have missed any overtime labor to allow packaging to catch up with production When the packager is down for m is exacerbated and we may spend several two-shift days catching up with production. I cannot deadlines because of packaging problems, but it is a constant concern becau around here y things would run a lot smoother with more reliable equipment. In fiscal 2016, we will pay about SGD15,470 p y SGD81.900 per year becouse of the overtime he has been working. The equipment is on the tax and cegreciation method for both tax and reporting purposes and will continue to do so). Because of changes in pack maintenance costs. The operator is paid SGD63,700 per year for his regular time, but he has been books at SGD218,400 and will be fully depreciated in three years (we are currently using the straight-ine aging technology, the bout equal to the cost of having it removed. In short, we believe the equipment has no salvage value at all. equipment has no market value other than its worth as scrap metal. But its scrap value is The new packager offers many advantages over the current equipment. It is faster, more rellable, more flexible with respect to the types of packaging it can perform, and will provide enough capacity to cover all our packaging the foreseeable future. With suitable maintenance, we believe the packager will operate indefinitely. Thus, needs in es of our analysis, we can assume that this will be the last packaging equipment we will ever have Because of the anticipated growth at Star River, the current equipment will not be able to handle our needs by the end of fiscal 2018. Thus, if we do not buy new packaging equipment by this years end. er three years anyway. Since the speed, capacity, and reliability of the new equipment will for overtime labor, we feel strongly that we should buy now rather than wait another three years have to buy it aft eliminate the need The new equipment is priced at SGD1.82 million, which we would depreciate over 10 years at SGD182.000 per year. It comes with a lifetime factory maintenance contract that covers all routine maintenance and repairs at a price of SGD3,640 for the initial year. The contract stipulates that the price after the first year will be increased by me percentage as the price increase of the new equipment. Thus if the manufacturer continues to increase price of new packaging equipment at 5% per annum as it has in the past, the maintenance costs of the new he sa eesment wil rise by 5% also, we believe that this sort of regular maintenance should insure that the new equipment Star per year, we keep operating in the foreseeable future without the need for a major overhaul. intenance costs will continue to rise due to inflation at approximately 1.5% per year over expect to save SGD286,878 in the purchase price by buying now rather than waiting three years ginal tax rate for this investment would be 24.5%


