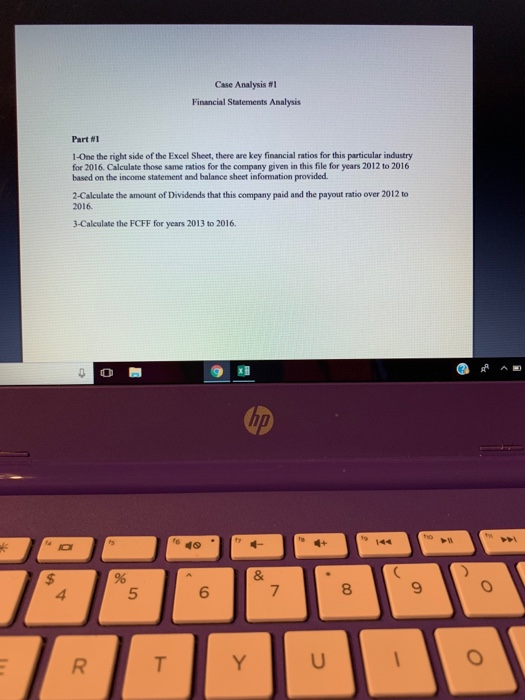
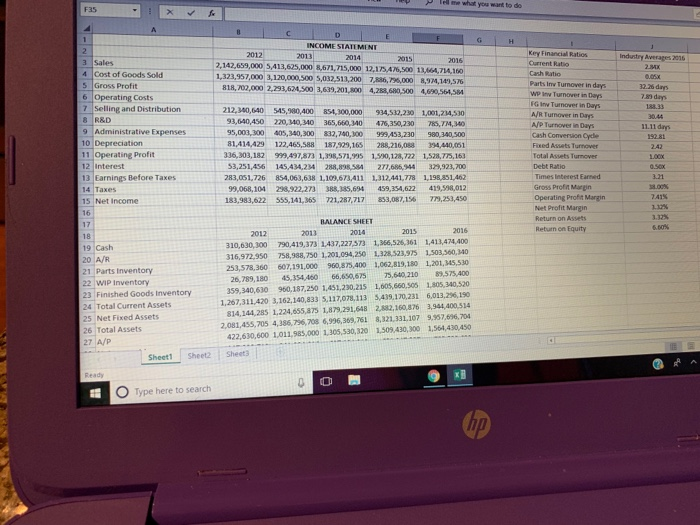
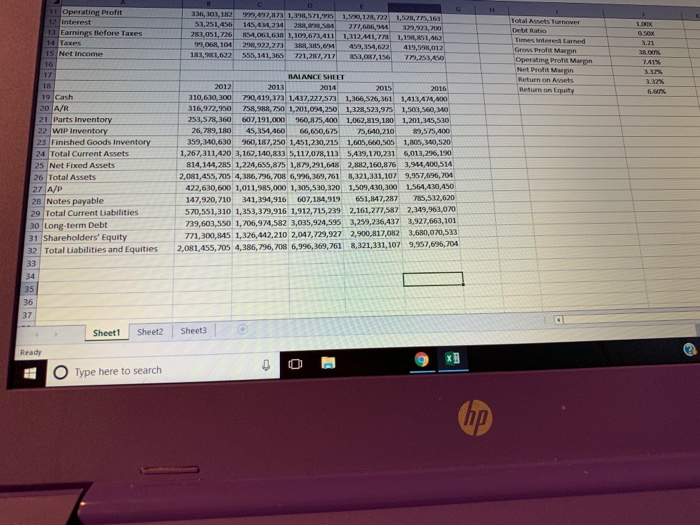
Case Analysis #1 Financial Statements Analysis Part #1 1-One the right side of the Excel Sheet, there are key financial ratios for this particular industry for 2016. Calculate those same ratios for the company given in this file for years 2012 to 2016 based on the income statement and balance sheet information provided 2-Calculate the amount of Dividends that this company paid and the payout ratio over 2012 to 2016 3-Calculate the FCFF for years 2013 to 2016. 5 6 7 8 9 D Tell me what you want to do F35 NCOME STATEMENT Key Financial Ratios 015 ?, 142,659,000 5,413,625.000 8,671,725,000. 12,15.4%,500. 13-mm160 . 1,323,957,000 3,120,000,500 5,032-513,200 7,886%000 8,974,149,576 13464,714160Current Ratio 4 Cost of Goods Sold 5 Gross Profit Cash Ratio wo lnw Turnover in Days G Inw Turnover in Days A/R Turnover in Days AjP Turnover in Days 6 Operating Costs 7 Selling and Distribution 8 R&D 91 Administrative Expenses 10 Depreciation 11 Operating Profit 12 Interest 13 Earnings Before Taxes 14 Taxes 783 days 212,340,640 545,980,400 854,300,000 934,532,230 1,001,234,530 93,040,450220,,340 365,660,340 476,350,230 7es,TA,MO 95,003,300 405,340,300 832,740,300999,453,230 980,340,500 81,414,429 122,465,588 187,929,165 288,216,088 394 440,061 336,303,182 999,497,873 1,398,571,935 1,590,128,722 1,528,75,163 3,251,456 145,434,234 288,898,584 277,686,944329,923,700 283,051,726 854,063,638 1,109,673,411 1.312 441,778 1,198,831402 99,068,104 298,922,273 388385,694 459,354,622 419,598,032 183,983,622 555,141,365 721,287,717 853,087,156779,253,450 Cash Conversion Cycle Fixed Assets Turnover Total Assets Turnover Times Interest Earned Gross Profn Mrgin Operating Profit Margin 741% 15 Net income Net Profit Margin 3.32% BALANCE SHEET Return on Equity 19 Cash 20 A/R 21 Parts Inventory 22 WIP Inventory 23 Finished Goods Inventory 24 Total Current Assets 25 Net Fixed Assets 26 Total Assets 10,630,300 790,419,373 1437,227573 1,366,526,361 1,413,474,400 316,972,950 758,988,750 1,201,094,250 1,328 523,975 1,503,560,340 253,578,360 607,191,000 960,875,400 1,062,819,180 1.201, 45,530 26,789,180 45,354,46066,650,675 75,640,210 89,575,400 359,340,630 960,187,250 1.451,230,215 1,605,660,500 1,805,340,5210 1,267,311.420 3,162,140,8335, 117,078.1 13 sair,231 6,013,2%, 190 814,144,285 1,224,655,875 1,879,291.648 2,882,160,876 3,944,400 514 2,081,455,705 4,386,796,708 6996,369,76 8,321,331,107 9,957,696,704 22,630,600 1,011,985,000 1,305,530,320 1,509 430,300 1,564,430,4540 Sheetl Sheet2Sheet3 0 Type here to search ip Operating Profit 13 Earnings Before Taxes 5 Net Income 53,251,456 145,434.234 28,272,68644 322,23,700 20,05 i,726L-MO6L6M 1,10,673,411-1,312,441,7 1,1%,RiAD 93,068,1012322.273 388, SHS 3,022 333,141, 36521,287,717 853,087,15 773,253450 Operating Profit Margin Net Profit Margin BALANCE SHEET 117/27374,5289251 0 9 Cash 20 A/R 21 Parts Inventory 310,630,300-790,419,373|1,437,227,573. 1,366S%)61 16,972,950 758,988, 750 1,201,094,250 1,328,523,97s 1,413,4 233,578,360 607,191,000 960,875,400 1062,819,180 1,201,345,530 6,789,180 45,354,460 66,650,67575,640210 3,575,400 359.340,630,187,250 1,451,20,215 1,605Ma,solue,340,520 1,267,311,4203, 152,140,813 5,117.078,113.5,439,170.231' 6,013,296,190 814,144,285 1,224,655,875 1,879,291,648 2,882,160,876 3,944,400,514 2,081,455, 705 4,386,796,708 6,996,369,761 8,321,331,107 9.957,696, 704 422,630,600 1,011,985,000 1,305,530,320 1,509,430,300 1,564,430,450 47,920,710 341,394,916 607,184,919 651,847,287785,532,620 570,551,310 1,353,379,916 1,912,715,239 2,161,277,587 2,349,963,020 739,603,550 1,706,974,582 3,035,924,595 3,259,236,437 3,927,663,101 771,300,845 1,326,442,.210 2,047,729,927 2,900,817,082 3,680,070,533 Wip Inventory 23 Finished Goods Inventory . 24 Total Current Assets 25 Net Fixed Assets . 26 Total Assets 28 Notes payable 29 Total Current Liabilities 0 Long-term Debt 1 Shareholders' Equity 321 Total liabilities and Equities 9957,696,104 2,081,455. m 4,386,7%,7086,9%,369,7618,321,331,107 Sheet1 Sheet2 Sheet3 Ready O Type here to search