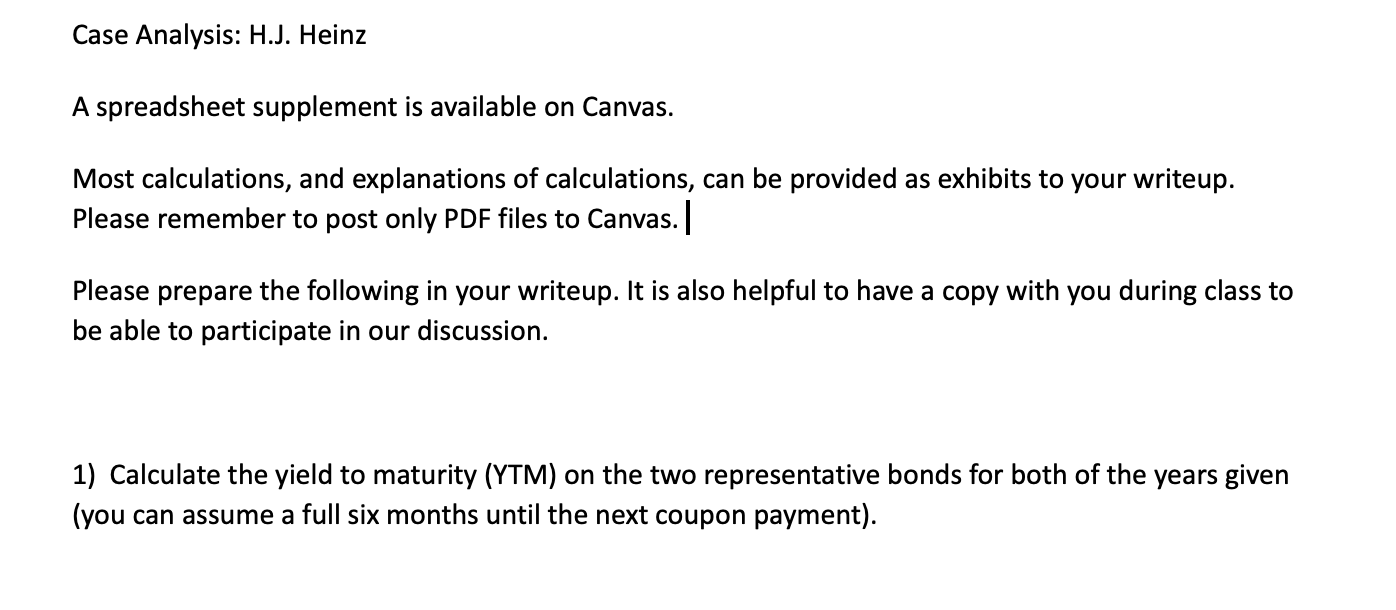
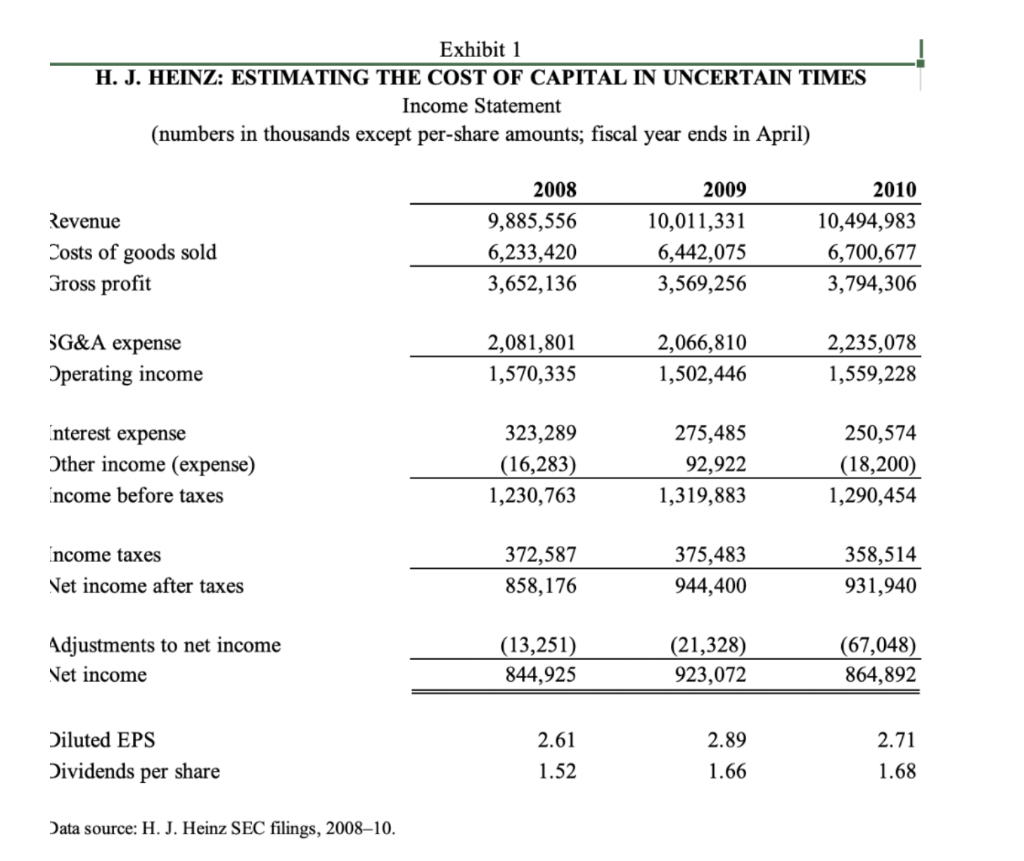
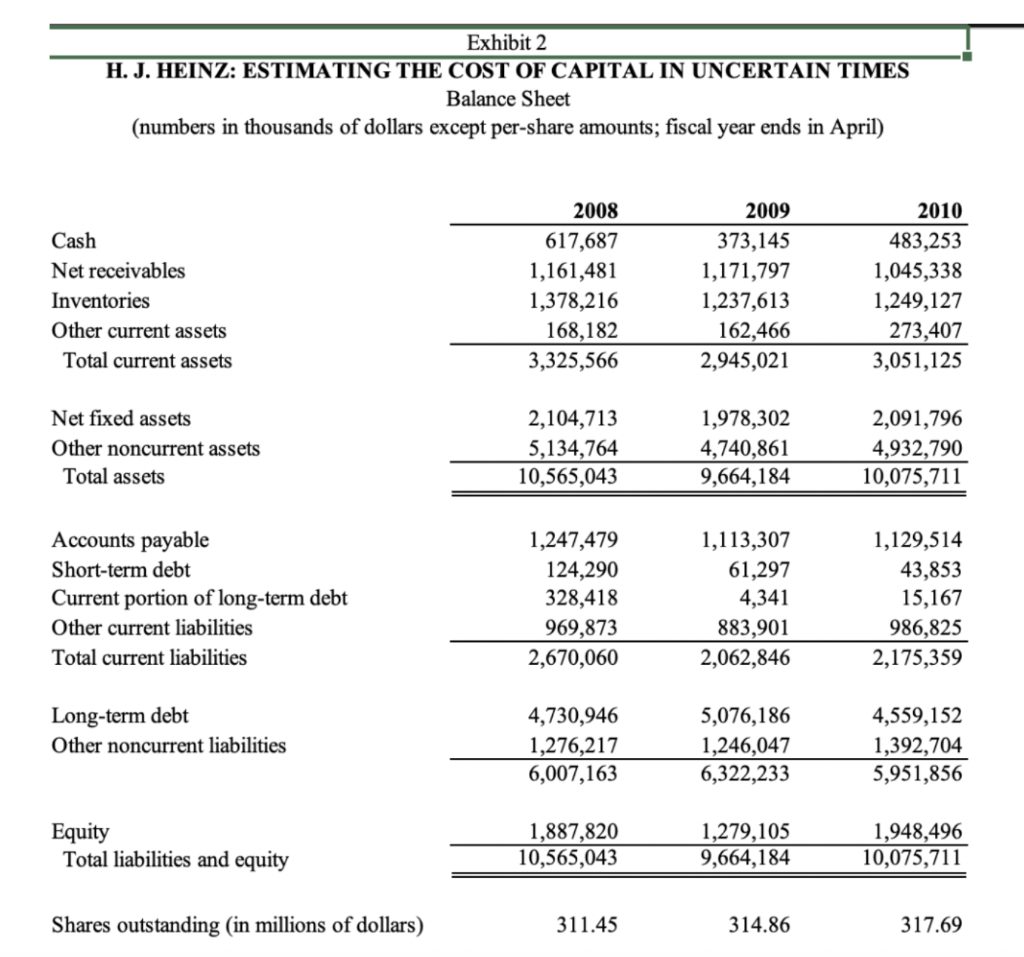
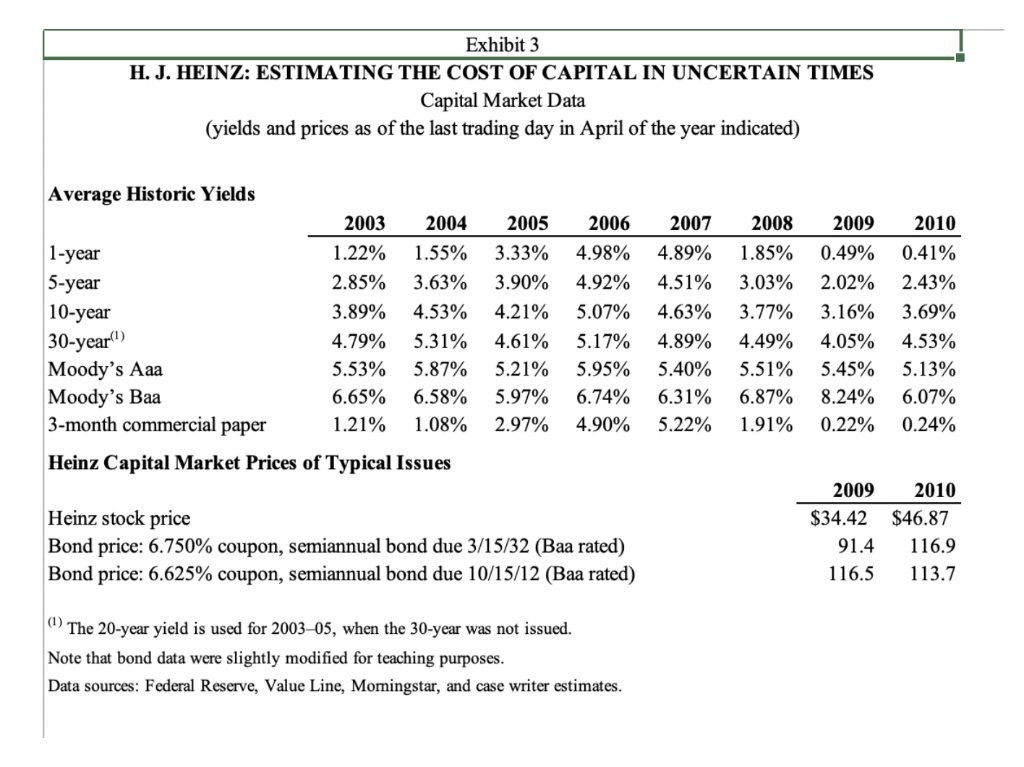
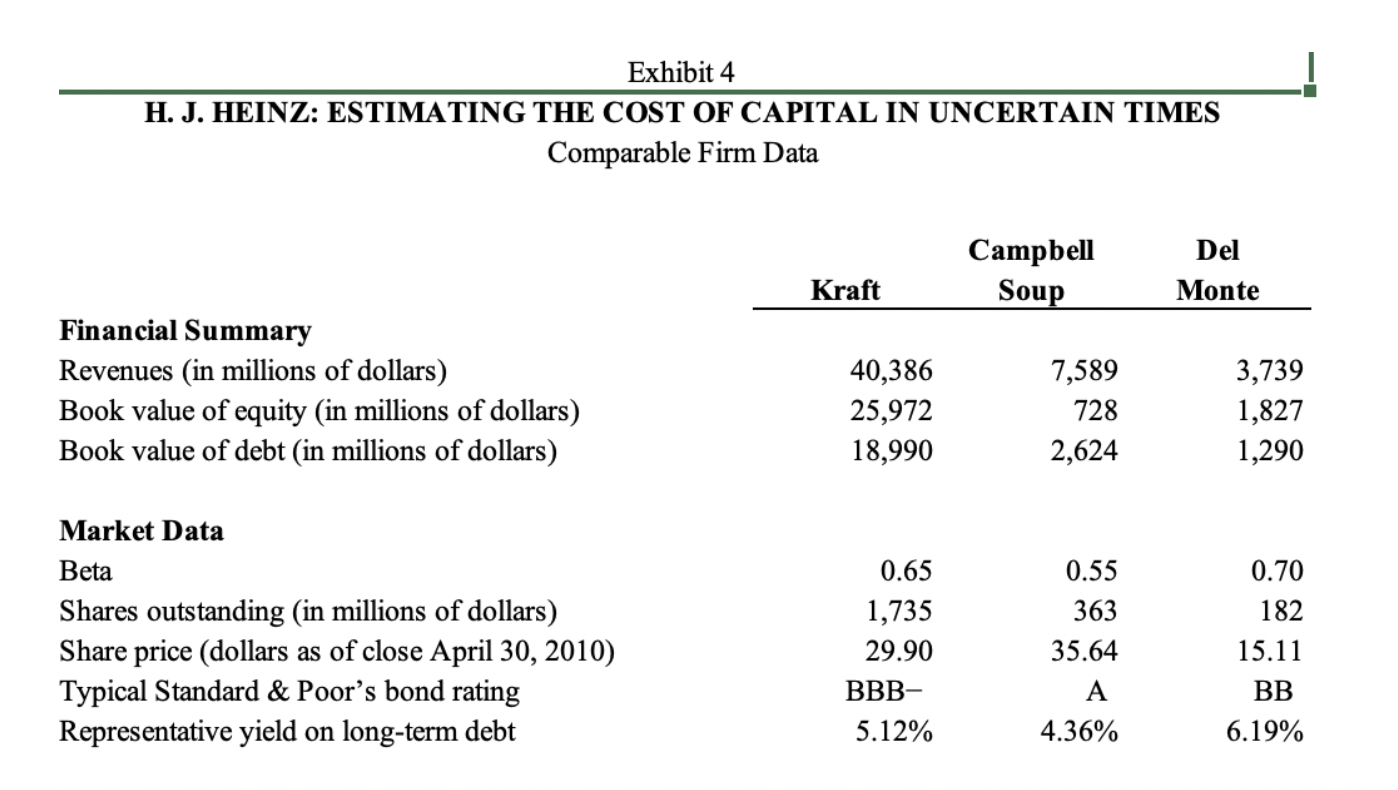
Case Analysis: H.J. Heinz A spreadsheet supplement is available on Canvas. Most calculations, and explanations of calculations, can be provided as exhibits to your writeup. Please remember to post only PDF files to Canvas. Please prepare the following in your writeup. It is also helpful to have a copy with you during class to be able to participate in our discussion. 1) Calculate the yield to maturity (YTM) on the two representative bonds for both of the years given (you can assume a full six months until the next coupon payment). Exhibit 1 H. J. HEINZ: ESTIMATING THE COST OF CAPITAL IN UNCERTAIN TIMES Income Statement (numbers in thousands except per-share amounts; fiscal year ends in April) 2008 Revenue Costs of goods sold Gross profit 9,885,556 6,233,420 3,652,136 2009 10,011,331 6,442,075 3,569,256 2010 10,494,983 6,700,677 3,794,306 SG&A expense 2,081,801 1,570,335 2,066,810 1,502,446 2,235,078 1,559,228 Operating income Interest expense Other income (expense) Income before taxes 323,289 (16,283) 1,230,763 275,485 92,922 1,319,883 250,574 (18,200) 1,290,454 Income taxes Net income after taxes 372,587 858,176 375,483 944,400 358,514 931,940 Adjustments to net income Net income (13,251) 844,925 (21,328) 923,072 (67,048) 864,892 Diluted EPS Dividends per share 2.61 1.52 2.89 1.66 2.71 1.68 Data source: H. J. Heinz SEC filings, 2008-10. Exhibit 2 H. J. HEINZ: ESTIMATING THE COST OF CAPITAL IN UNCERTAIN TIMES Balance Sheet (numbers in thousands of dollars except per-share amounts; fiscal year ends in April) Cash Net receivables Inventories Other current assets Total current assets 2008 617,687 1,161,481 1,378,216 168,182 3,325,566 2009 373,145 1,171,797 1,237,613 162,466 2,945,021 2010 483,253 1,045,338 1,249,127 273,407 3,051,125 Net fixed assets Other noncurrent assets Total assets 2,104,713 5,134,764 10,565,043 1,978,302 4,740,861 9,664,184 2,091,796 4,932,790 10,075,711 Accounts payable Short-term debt Current portion of long-term debt Other current liabilities Total current liabilities 1,247,479 124,290 328,418 969,873 2,670,060 1,113,307 61,297 4,341 883,901 2,062,846 1,129,514 43,853 15,167 986,825 2,175,359 Long-term debt Other noncurrent liabilities 4,730,946 1,276,217 6,007,163 5,076,186 1,246,047 6,322,233 4,559,152 1,392,704 5,951,856 Equity Total liabilities and equity 1,887,820 10,565,043 1,279,105 9,664,184 1,948,496 10,075,711 Shares outstanding (in millions of dollars) 311.45 314.86 317.69 Exhibit 3 H. J. HEINZ: ESTIMATING THE COST OF CAPITAL IN UNCERTAIN TIMES Capital Market Data (yields and prices as of the last trading day in April of the year indicated) Average Historic Yields 2003 2004 2005 2009 2010 1-year 1.22% 1.55% 5-year 2.85% 3.63% 10-year 3.89% 4.53% 30-year) 4.79% 5.31% Moody's Aaa 5.53% 5.87% Moody's Baa 6.65% 6.58% 3-month commercial paper 1.21% 1.08% Heinz Capital Market Prices of Typical Iss 3.33% 3.90% 4.21% 4.61% 5.21% 5.97% 2.97% 2006 4.98% 4.92% 5.07% 5.17% 5.95% 6.74% 4.90% 2007 4.89% 4.51% 4.63% 4.89% 5.40% 6.31% 5.22% 2008 1.85% 3.03% 3.77% 4.49% 5.51% 6.87% 1.91% 0.49% 2.02% 3.16% 4.05% 5.45% 8.24% 0.22% 0.41% 2.43% 3.69% 4.53% 5.13% 6.07% 0.24% Heinz stock price Bond price: 6.750% coupon, semiannual bond due 3/15/32 (Baa rated) Bond price: 6.625% coupon, semiannual bond due 10/15/12 (Baa rated) 2009 2010 $34.42 $46.87 91.4 116.9 116.5 113.7 "The 20-year yield is used for 200305, when the 30-year was not issued. Note that bond data were slightly modified for teaching purposes. Data sources: Federal Reserve, Value Line, Morningstar, and case writer estimates. Exhibit 4 H. J. HEINZ: ESTIMATING THE COST OF CAPITAL IN UNCERTAIN TIMES Comparable Firm Data Campbell Soup Del Monte Kraft Financial Summary Revenues (in millions of dollars) Book value of equity (in millions of dollars) Book value of debt (in millions of dollars) 40,386 25,972 18,990 7,589 728 2,624 3,739 1,827 1,290 Market Data Beta Shares outstanding (in millions of dollars) Share price (dollars as of close April 30, 2010) Typical Standard & Poor's bond rating Representative yield on long-term debt 0.65 1,735 29.90 BBB- 5.12% 0.55 363 35.64 A 4.36% 0.70 182 15.11 BB 6.19% Case Analysis: H.J. Heinz A spreadsheet supplement is available on Canvas. Most calculations, and explanations of calculations, can be provided as exhibits to your writeup. Please remember to post only PDF files to Canvas. Please prepare the following in your writeup. It is also helpful to have a copy with you during class to be able to participate in our discussion. 1) Calculate the yield to maturity (YTM) on the two representative bonds for both of the years given (you can assume a full six months until the next coupon payment). Exhibit 1 H. J. HEINZ: ESTIMATING THE COST OF CAPITAL IN UNCERTAIN TIMES Income Statement (numbers in thousands except per-share amounts; fiscal year ends in April) 2008 Revenue Costs of goods sold Gross profit 9,885,556 6,233,420 3,652,136 2009 10,011,331 6,442,075 3,569,256 2010 10,494,983 6,700,677 3,794,306 SG&A expense 2,081,801 1,570,335 2,066,810 1,502,446 2,235,078 1,559,228 Operating income Interest expense Other income (expense) Income before taxes 323,289 (16,283) 1,230,763 275,485 92,922 1,319,883 250,574 (18,200) 1,290,454 Income taxes Net income after taxes 372,587 858,176 375,483 944,400 358,514 931,940 Adjustments to net income Net income (13,251) 844,925 (21,328) 923,072 (67,048) 864,892 Diluted EPS Dividends per share 2.61 1.52 2.89 1.66 2.71 1.68 Data source: H. J. Heinz SEC filings, 2008-10. Exhibit 2 H. J. HEINZ: ESTIMATING THE COST OF CAPITAL IN UNCERTAIN TIMES Balance Sheet (numbers in thousands of dollars except per-share amounts; fiscal year ends in April) Cash Net receivables Inventories Other current assets Total current assets 2008 617,687 1,161,481 1,378,216 168,182 3,325,566 2009 373,145 1,171,797 1,237,613 162,466 2,945,021 2010 483,253 1,045,338 1,249,127 273,407 3,051,125 Net fixed assets Other noncurrent assets Total assets 2,104,713 5,134,764 10,565,043 1,978,302 4,740,861 9,664,184 2,091,796 4,932,790 10,075,711 Accounts payable Short-term debt Current portion of long-term debt Other current liabilities Total current liabilities 1,247,479 124,290 328,418 969,873 2,670,060 1,113,307 61,297 4,341 883,901 2,062,846 1,129,514 43,853 15,167 986,825 2,175,359 Long-term debt Other noncurrent liabilities 4,730,946 1,276,217 6,007,163 5,076,186 1,246,047 6,322,233 4,559,152 1,392,704 5,951,856 Equity Total liabilities and equity 1,887,820 10,565,043 1,279,105 9,664,184 1,948,496 10,075,711 Shares outstanding (in millions of dollars) 311.45 314.86 317.69 Exhibit 3 H. J. HEINZ: ESTIMATING THE COST OF CAPITAL IN UNCERTAIN TIMES Capital Market Data (yields and prices as of the last trading day in April of the year indicated) Average Historic Yields 2003 2004 2005 2009 2010 1-year 1.22% 1.55% 5-year 2.85% 3.63% 10-year 3.89% 4.53% 30-year) 4.79% 5.31% Moody's Aaa 5.53% 5.87% Moody's Baa 6.65% 6.58% 3-month commercial paper 1.21% 1.08% Heinz Capital Market Prices of Typical Iss 3.33% 3.90% 4.21% 4.61% 5.21% 5.97% 2.97% 2006 4.98% 4.92% 5.07% 5.17% 5.95% 6.74% 4.90% 2007 4.89% 4.51% 4.63% 4.89% 5.40% 6.31% 5.22% 2008 1.85% 3.03% 3.77% 4.49% 5.51% 6.87% 1.91% 0.49% 2.02% 3.16% 4.05% 5.45% 8.24% 0.22% 0.41% 2.43% 3.69% 4.53% 5.13% 6.07% 0.24% Heinz stock price Bond price: 6.750% coupon, semiannual bond due 3/15/32 (Baa rated) Bond price: 6.625% coupon, semiannual bond due 10/15/12 (Baa rated) 2009 2010 $34.42 $46.87 91.4 116.9 116.5 113.7 "The 20-year yield is used for 200305, when the 30-year was not issued. Note that bond data were slightly modified for teaching purposes. Data sources: Federal Reserve, Value Line, Morningstar, and case writer estimates. Exhibit 4 H. J. HEINZ: ESTIMATING THE COST OF CAPITAL IN UNCERTAIN TIMES Comparable Firm Data Campbell Soup Del Monte Kraft Financial Summary Revenues (in millions of dollars) Book value of equity (in millions of dollars) Book value of debt (in millions of dollars) 40,386 25,972 18,990 7,589 728 2,624 3,739 1,827 1,290 Market Data Beta Shares outstanding (in millions of dollars) Share price (dollars as of close April 30, 2010) Typical Standard & Poor's bond rating Representative yield on long-term debt 0.65 1,735 29.90 BBB- 5.12% 0.55 363 35.64 A 4.36% 0.70 182 15.11 BB 6.19%