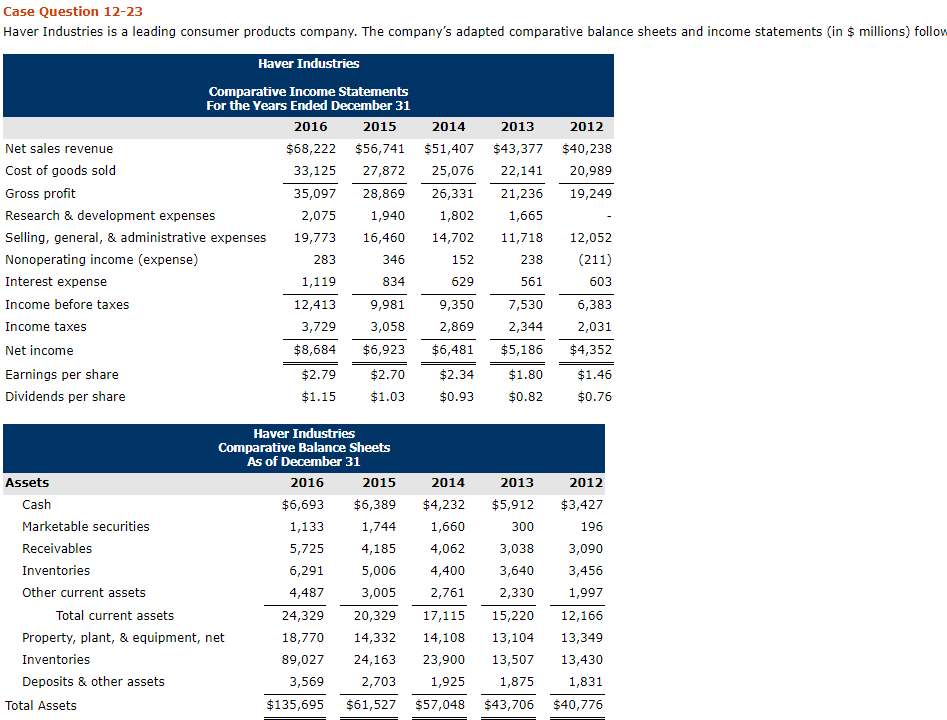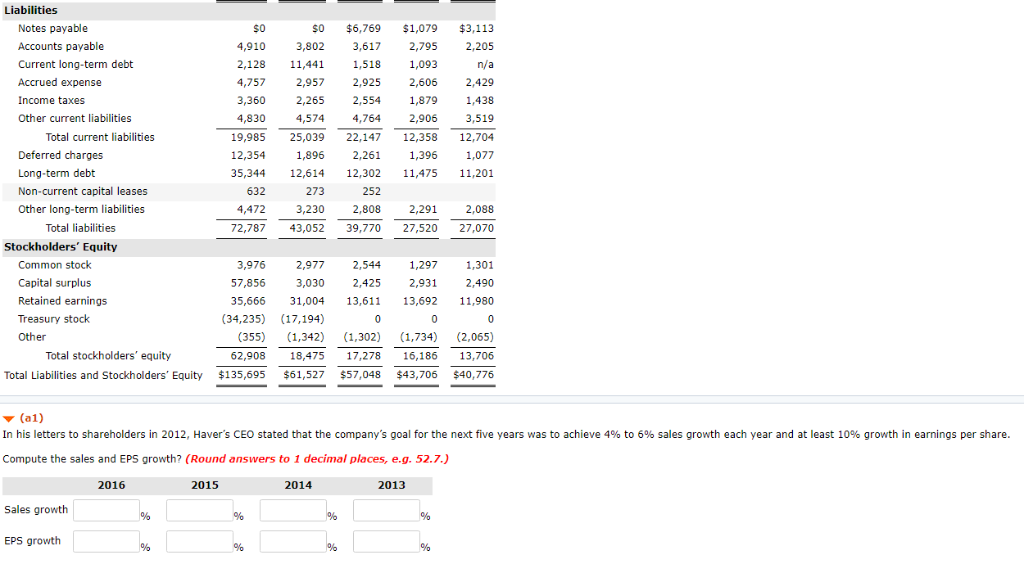

Case Question 12-23 Haver Industries is a leading consumer products company. The company's adapted comparative balance sheets and income statements (in $ millions) follow Haver Industries Comparative Income Statements For the Years Ended December 31 2014 $68,222 $56,741 $51,407 $43,377 $40,238 33,125 27,872 25,076 22,141 20,989 35,097 28,869 26,331 21,236 19,249 1,802 14,702 2016 2015 2013 2012 Net sales revenue Cost of goods sold Gross profit Research & development expenses Selling, general, & administrative expenses Nonoperating income (expense) Interest expense Income before taxes Income taxes Net income Earnings per share Dividends per share 2,075 19,773 283 1,119 12,413 3,729 1,940 16,460 346 834 9,981 3,058 1,665 11,718 12,052 238(211) 603 6,383 2,031 152 629 561 7,530 2,344 9,350 2,869 $8,684 $6,923 $6,481 $5,186 $4,352 2.79 $2.70 $2.34 $1.80$1.46 $1.15 $1.03$0.93 $0.82$0.76 Haver Industries Comparative Balance Sheets As of December 31 Asset 2016 2015 2014 2013 2012 as Marketable securities Receivables Inventories Other current assets $6,693 $6,389 $4,232 $5,912 $3,427 1,660 4,062 4,400 2,761 24,329 20,329 17,11515,220 12,166 18,77014,332 14,108 13,104 13,349 89,027 24,163 23,900 13,507 13,430 1,925 1,133 5,725 6,291 4,487 1,744 4,185 5,006 3,005 300 3,038 3,640 2,330 196 3,090 3,456 1,997 Total current assets Property, plant, & equipment, net Inventories Deposits & other assets 3,569 2,703 1,875 Total Assets $135,695 $61,527 $57,048 $43,706 $40,776 Liabilities Notes payable Accounts payable Current long-term debt Accrued expense Income taxes Other current liabilities $0 $6,769 $1,079 $3,113 4,910 3,8023,617 2,795 2,205 s0 2,128 11,441 1,518 1,093 4,75772,925 2,606 2,429 3,360 2,2652,554 1,879 1,438 3,519 19,985 25,039 22,147 12,358 12,704 1,896 2,2611,396 1,077 35,344 12,614 12,302 11,475 11,20:1 4,830 4,574 4,764 2,906 Total current liabilities 12,354 Deferred charges Long-term debt Non-current capital leases Other long-term liabilities 632 273 252 4,4723,230 2,808 2,291 2,088 72,787 43,052 39,770 27,520 27,070 Total liabilities Stockholders Equity Common stock Capital surplus Retained earnings Treasury stock Other 3,976 2,977 2,544 1,297 1,301 2,490 35,666 31,004 13,611 13,692 11,980 57,856 3,030 2,425 2,931 (34,235) (17,194) (355) (1,342) (1,302) (1,734) (2,065) 18,475 17,278 16,186 13,706 Total Liabilities and Stockholders' Equity $135,695 $61,527 $57,048 $43,706 $40,776 Total stockholders' equity 62,908 (a1) In his letters to shareholders in 2012, Haver's CEO stated that the company's goal for the next five years was to achieve 4% to 6% sales growth each year and at least 10% growth in earnings per share. Compute the sales and EPS growth? (Round answers to 1 decimal places, e.g. 52.7.) 2016 2015 2014 2013 Sales growth EPS growth


