

Question
CASE STUDY 1: The clinic manager Mr. Khalid is the clinic manager at a large hospital in Jeddah. At the end of each week, the
CASE STUDY 1: The clinic manager
Mr. Khalid is the clinic manager at a large hospital in Jeddah. At the end of each week, the clinic
manager collects the feedback forms from the locked comments box located in the reception room. The
results are tabulated and shared with clinic staff every month. At one monthly meeting, the clinic manager
reports that many patients complain about the amount of time they must wait before they are seen by a
care provider. The providers expect clinic staff to bring patients to the exam room within ten minutes of
their arrival.
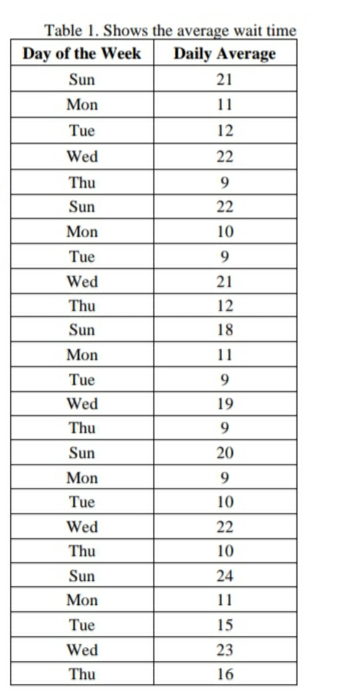
To determine whether this goal is being met, the clinic gathers data for five weeks on patient wait
times. Patients are asked to sign in and indicate their arrival time on a sheet at the registration desk. The
medical assistant then records the time patients are brought to an exam room. Data on wait time were
collected for the morning and afternoon shifts, data for the entire day is averaged to give a daily average
for each day of the week. The daily averages of the clinic's gathered data for five weeks on patient wait
times are presented in Table 1.
Further investigation shows that the clinic services a large number of walk-in patients on Sunday
and Wednesday. The wait time data help the clinic pinpoint where improvements are needed. The clinic
manager meets with the care providers to discuss ways of changing the current process to reduce
bottlenecks and improve customer satisfaction. The physicians ask that fewer patients be scheduled for
appointments on Sunday and Wednesday.
Based on past experience the clinic manager has set forth the normal range and average wait time
(mean) to be 15 minutes and the upper limit to be 20 minutes and the lower limit to be 10 minutes.
Performance measures must be accurate. Accuracy relates to the correctness of the numbers. For example,
in the above case study, the time the patient entered the clinic must be precisely recorded on the
registration sign-in sheet. Otherwise, the wait time calculation will be wrong.
Performance measures must be uniformly reported to make meaningful comparisons between the
results from one period and the results from another period. For example, suppose the clinic manager
starts calculating patient wait time information differently. He changes the wait time end point from the
time the patient leaves the reception area to the time the patient is seen by a care provider. This slight
change in the way wait times are calculated could dramatically affect performance results.
Questions
1. Construct a statistical control chart using the data
presented in table 1, the line graph should contain a
mean line and upper and lower limits of the normal
range presented in the case.
2. Illustrates how this statistical control chart technique
is applied during performance assessment?
3. Based on the analysis what type of problem(s) you
think the clinics have?
4. Do you think the clinic manager defined the problem
correctly the first time? Why or why not?
5. What do you think the best solution to this problem?
6. Do you think it is possible to use the problem-
solving process model under the condition of
deviation shown in Figure 6.4? Why not?
7. Looking at the statistical control chart that you have
constructed, do you see any "trends" in the data?
What does it mean?
8. Do you think the clinic manager should change the
process, when should it be changed, and how it
should be changed?
Step by Step Solution
There are 3 Steps involved in it
Step: 1

Get Instant Access to Expert-Tailored Solutions
See step-by-step solutions with expert insights and AI powered tools for academic success
Step: 2

Step: 3
Ace Your Homework with AI
Get the answers you need in no time with our AI-driven, step-by-step assistance
Get Started
Precalculus
Authors: Michael Sullivan
10th Global Edition
1292121772, 1292121777, 978-1292121772