Answered step by step
Verified Expert Solution
Question
1 Approved Answer
Case study (12 points) WIZZ AIR HOLDING PLC. Wizz Air Holdings Plc is a low-cost airline company. Together with its subsidiaries, it provides passenger


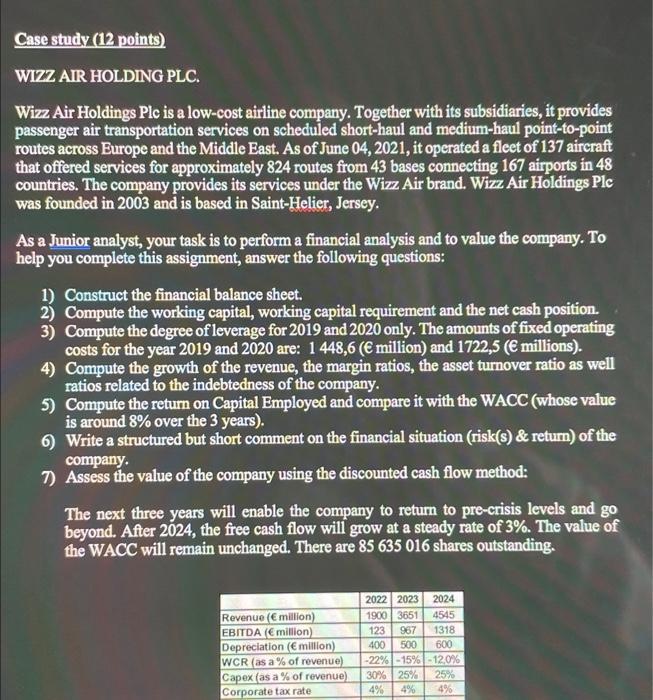
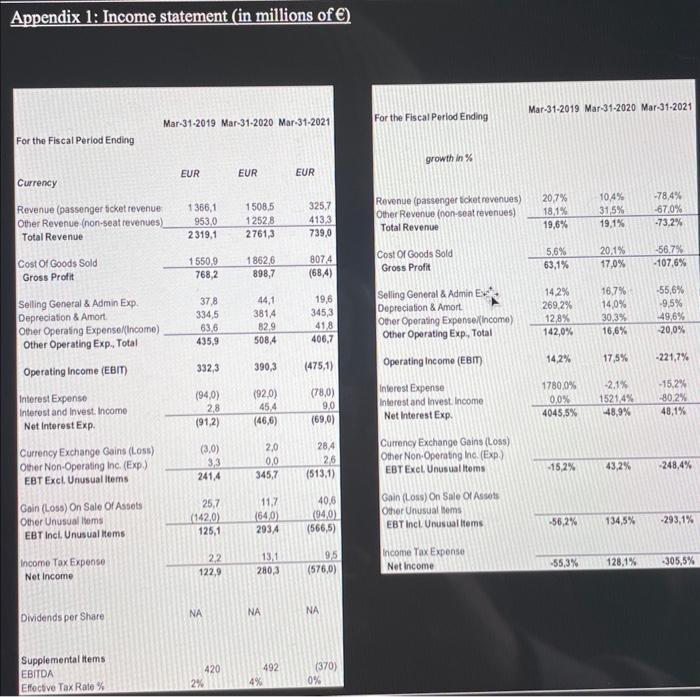
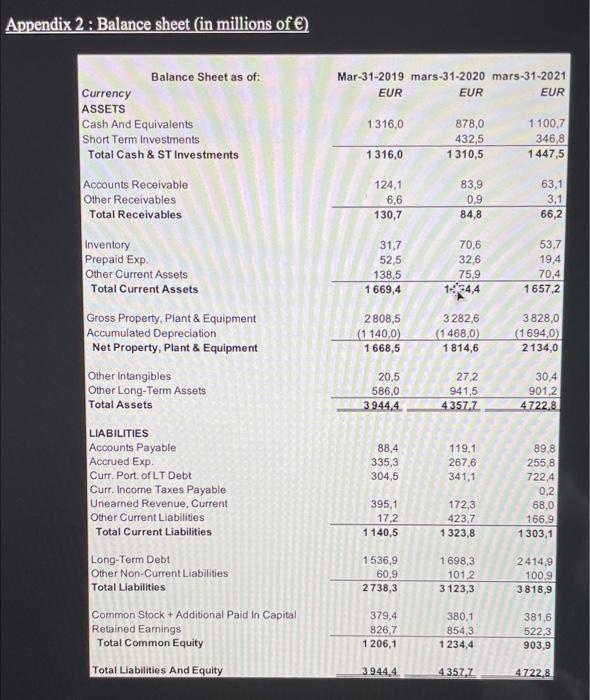
Case study (12 points) WIZZ AIR HOLDING PLC. Wizz Air Holdings Plc is a low-cost airline company. Together with its subsidiaries, it provides passenger air transportation services on scheduled short-haul and medium-haul point-to-point routes across Europe and the Middle East. As of June 04, 2021, it operated a fleet of 137 aircraft that offered services for approximately 824 routes from 43 bases connecting 167 airports in 48 countries. The company provides its services under the Wizz Air brand. Wizz Air Holdings Plc was founded in 2003 and is based in Saint-Helier, Jersey. As a Junior analyst, your task is to perform a financial analysis and to value the company. To help you complete this assignment, answer the following questions: 1) Construct the financial balance sheet. 2) Compute the working capital, working capital requirement and the net cash position. 3) Compute the degree of leverage for 2019 and 2020 only. The amounts of fixed operating costs for the year 2019 and 2020 are: 1 448,6 ( million) and 1722,5 ( millions). 4) Compute the growth of the revenue, the margin ratios, the asset turnover ratio as well ratios related to the indebtedness of the company. 5) Compute the return on Capital Employed and compare it with the WACC (whose value is around 8% over the 3 years). 6) Write a structured but short comment on the financial situation (risk(s) & return) of the company. 7) Assess the value of the company using the discounted cash flow method: The next three years will enable the company to return to pre-crisis levels and go beyond. After 2024, the free cash flow will grow at a steady rate of 3%. The value of the WACC will remain unchanged. There are 85 635 016 shares outstanding. Revenue (E million) EBITDA ( million) Depreciation ( million) WCR (as a % of revenue) Capex (as a % of revenue) Corporate tax rate 2022 2023 2024 1900 3651 4545 123 967 1318 600 400 500 -22% -15% -12,0% 30% 25% 25% 4% 4% 4% Appendix 1: Income statement (in millions of ) For the Fiscal Period Ending Currency Revenue (passenger ticket revenue Other Revenue (non-seat revenues) Total Revenue Cost Of Goods Sold Gross Profit Selling General & Admin Exp. Depreciation & Amort Other Operating Expense/(Income) Other Operating Exp., Total Operating Income (EBIT) Interest Expense Interest and Invest. Income Net Interest Exp. Currency Exchange Gains (Loss) Other Non-Operating Inc. (Exp.) EBT Excl. Unusual Items Gain (Loss) On Sale Of Assets Other Unusual Items EBT Incl. Unusual Items Income Tax Expense Net Income Dividends per Share Mar-31-2019 Mar-31-2020 Mar-31-2021 Supplemental Items EBITDA Effective Tax Rate % EUR 1366,1 953,0 2319,1 1550,9 768,2 37,8 334,5 63,6 435,9 332,3 (94,0) 2,8 (91,2) (3,0) 3,3 241,4 25,7 (142.0) 125,1 2,2 122,9 NA 420 2% EUR 1508,5 1252,8 2761,3 1862,6 898,7 44,1 3814 82.9 508,4 390,3 (92,0) 45,4 (46,6) 2,0 0,0 345,7 11,7 (64,0) 293,4 13,1 280,3 NA 492 4% EUR 325,7 413,3 739,0 807.4 (68,4) 19,6 345,3 41,8 406,7 (475,1) (78,0) 9,0 (69,0) 28,4 26 (513,1) 40,6 (94,0) (566,5) 9,5 (576,0) NA (370) 0% For the Fiscal Period Ending growth in % Revenue (passenger ticket revenues) Other Revenue (non-seat revenues) Total Revenue Cost Of Goods Sold Gross Profit Selling General & Admin Ev Depreciation & Amort Other Operating Expense/(Income) Other Operating Exp, Total Operating Income (EBIT) Interest Expense Interest and Invest Income Net Interest Exp. Currency Exchange Gains (Loss) Other Non-Operating Inc. (Exp.) EBT Excl Unusual Items Gain (Loss) On Sale Of Assets Other Unusual Items EBT Incl. Unusual Items Income Tax Expense Net Income Mar-31-2019 Mar-31-2020 Mar-31-2021 20,7% 18,1% 19,6% 5,6% 63,1% 14,2% 269,2% 12,8% 142,0% 14,2% 1780,0% 0,0% 4045,5% -15,2% -56,2% -55,3% 10,4% 31,5% 19,1% 20.1% 17,0% 16,7% 14,0% 30,3% 16,6% 17,5% -2.1% 1521,4% 48,9% 43,2% 134,5% 128,1% -78,4% -67,0% -73,2% -56,7% -107,6% -55,6% -9,5% 49,6% -20,0% -221,7% -15,2% -80,2% 48,1% -248,4% -293,1% -305,5% Appendix 3: Sector averages and other information Revenue growth EBITDA margin EBIT margin Net Income margin ATO ROCE Financial leverage 2018 16% 11% 8% 2,79 29% 0,73 2019 8% 14% 9% 6% 2,76 24% 0,91 2020 4% -2% -7% 1,73 5% 1,20 2021 -50% -32% -48% -57% 0,78 -34% 3,84 "The major expenses that affect companies in the airline industry are labor and fuel costs. Labor costs are largely fixed in the short-term, while fuel costs can swing wildly based on the price of oil. Historically, the airline industry continues to be brutally competitive, even though the business of flying people all over the world and country has become an integral part of human life. The cost of flying continues to trend lower. The Internet has also created greater price transparency, reducing margins." (source: Investopedia) Newswise (29-Oct-2020)-The COVID-19 pandemic has caused a dramatic reduction in travel [...]. Figures show that in the second quarter of this year, airlines suffered an 80% fall in income compared to 2019, as the passenger fleet was brought to a virtual standstill, according to data from the International Air Transport Association [...]. For 2020, there will be a 50% fall in seat numbers for the airline industry, representing almost 3 billion fewer passengers end 400 billion dollars in loss of income. Although these shocking figures affect the whole industry, low-cost airlines have proven more adaptable to this uncertain outlook, as Suau-Sanchez reports in his research published in the Journal of Transport Geography, in conjunction with Edgar Jimenez, from Cranfield University (United Kingdom). According to the study, these airlines have shown greater resilience than traditional ones, due to their lower exposure to international long-haul traffic, which has been considerably disrupted by the health crisis. Indeed, the fall in seat numbers offered in March and April 2020 was much sharper in traditional airlines than low-cost ones, while the recovery is similar in both, as travel restrictions are gradually lifted. According to the UOC researcher, "Low-cost airlines operate in regional (intracontinental) markets and are therefore less exposed to the dynamics of long-haul (intercontinental) markets, which were the first to be grounded in early February and have remained inactive for longer due to government restrictions". Appendix 2 : Balance sheet (in millions of ) Currency ASSETS Balance Sheet as of: Cash And Equivalents Short Term Investments Total Cash & ST Investments Accounts Receivable Other Receivables Total Receivables Inventory Prepaid Exp. Other Current Assets Total Current Assets Gross Property, Plant & Equipment Accumulated Depreciation Net Property, Plant & Equipment Other Intangibles Other Long-Term Assets Total Assets LIABILITIES Accounts Payable Accrued Exp. Curr. Port of LT Debt Curr. Income Taxes Payable Unearned Revenue, Current Other Current Liabilities Total Current Liabilities Long-Term Debt Other Non-Current Liabilities Total Liabilities Common Stock + Additional Paid In Capital Retained Earnings Total Common Equity Total Liabilities And Equity Mar-31-2019 mars-31-2020 mars-31-2021 EUR 1316,0 1316,0 124,1 6,6 130,7 31,7 52,5 138,5 1669,4 2808,5 (1140,0) 1668,5 20,5 586,0 3.944,4 88,4 335,3 304,5 395,1 17,2 1140,5 1536,9 60,9 2738,3 379,4 826,7 1 206,1 3.944,4 EUR 878,0 432,5 1310,5 83,9 0,9 84,8 70,6 32,6 75,9 134,4 3282,6 (1468,0) 1814,6 27,2 941,5 4357.7 119,1 267,6 341,1 172,3 423,7 1323,8 1698,3 101,2 3123,3 380,1 854,3 1234,4 4.357,7 EUR 1.100,7 346,8 1447,5 63,1 3,1 66,2 53,7 19,4 70,4 1657,2 3828,0 (1694,0) 2134,0 30,4 901,2 4.722,8 89,8 255,8 722,4 0,2 68,0 166,9 1303,1 2414,9 100,9 3818,9 381,6 522,3 903,9 4722.8 Appendix 3: Sector averages and other information Revenue growth EBITDA margin EBIT margin Net Income margin ATO ROCE Financial leverage 2018 16% 11% 8% 2,79 29% 0,73 2019 8% 14% 9% 6% 2,76 24% 0,91 2020 4% -2% -7% 1,73 5% 1,20 2021 -50% -32% -48% -57% 0,78 -34% 3,84 "The major expenses that affect companies in the airline industry are labor and fuel costs. Labor costs are largely fixed in the short-term, while fuel costs can swing wildly based on the price of oil. Historically, the airline industry continues to be brutally competitive, even though the business of flying people all over the world and country has become an integral part of human life. The cost of flying continues to trend lower. The Internet has also created greater price transparency, reducing margins." (source: Investopedia) Newswise (29-Oct-2020)-The COVID-19 pandemic has caused a dramatic reduction in travel [...]. Figures show that in the second quarter of this year, airlines suffered an 80% fall in income compared to 2019, as the passenger fleet was brought to a virtual standstill, according to data from the International Air Transport Association [...]. For 2020, there will be a 50% fall in seat numbers for the airline industry, representing almost 3 billion fewer passengers end 400 billion dollars in loss of income. Although these shocking figures affect the whole industry, low-cost airlines have proven more adaptable to this uncertain outlook, as Suau-Sanchez reports in his research published in the Journal of Transport Geography, in conjunction with Edgar Jimenez, from Cranfield University (United Kingdom). According to the study, these airlines have shown greater resilience than traditional ones, due to their lower exposure to international long-haul traffic, which has been considerably disrupted by the health crisis. Indeed, the fall in seat numbers offered in March and April 2020 was much sharper in traditional airlines than low-cost ones, while the recovery is similar in both, as travel restrictions are gradually lifted. According to the UOC researcher, "Low-cost airlines operate in regional (intracontinental) markets and are therefore less exposed to the dynamics of long-haul (intercontinental) markets, which were the first to be grounded in early February and have remained inactive for longer due to government restrictions".
Step by Step Solution
★★★★★
3.32 Rating (152 Votes )
There are 3 Steps involved in it
Step: 1
Wizz Air Holdings Plc Financial Analysis and Valuation 1 Financial Balance Sheet Assets 2019 2020 2021 Cash and Equivalents 13160 8780 11007 Short Term Investments 4325 3468 13160 Total Cash ST Invest...
Get Instant Access to Expert-Tailored Solutions
See step-by-step solutions with expert insights and AI powered tools for academic success
Step: 2

Step: 3

Ace Your Homework with AI
Get the answers you need in no time with our AI-driven, step-by-step assistance
Get Started


