

Question
Case Study on Taco Shells in Chapter 10 Consider the following data: 0.2, 1.4, 19.0, 20.3, 5.3, 4.4, 2.8, 15.7, 1.4, 7.6, 2.2, 8.3, 3.6,
Case Study on Taco Shells in Chapter 10
Consider the following data:
0.2, 1.4, 19.0, 20.3, 5.3, 4.4, 2.8, 15.7, 1.4, 7.6, 2.2, 8.3, 3.6, 5.3, 19.0
Use the chi-square test to test the hypothesis that the data comes from an exponential distribution.
You may do these problems in whatever way you likeby hand, using the software.
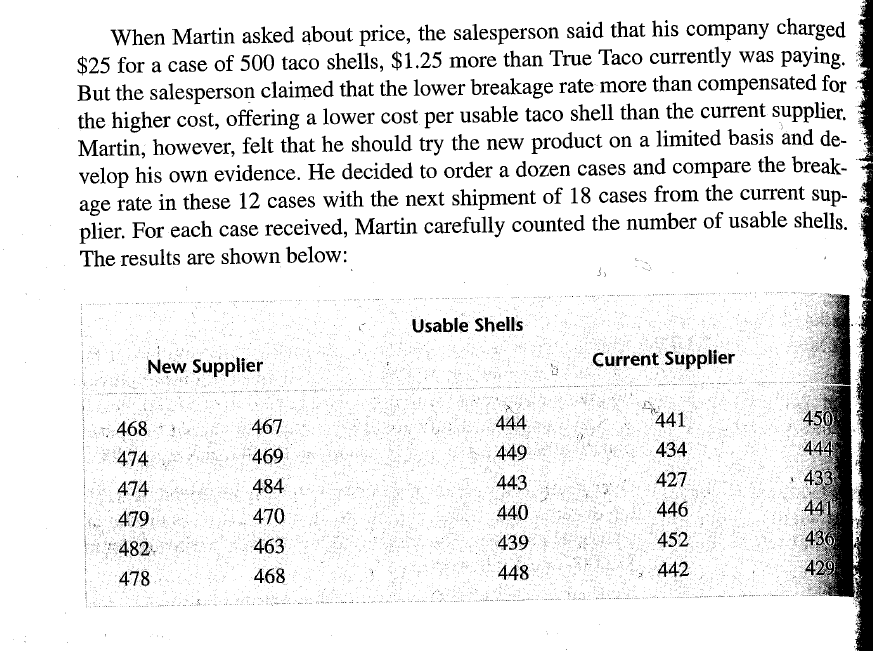
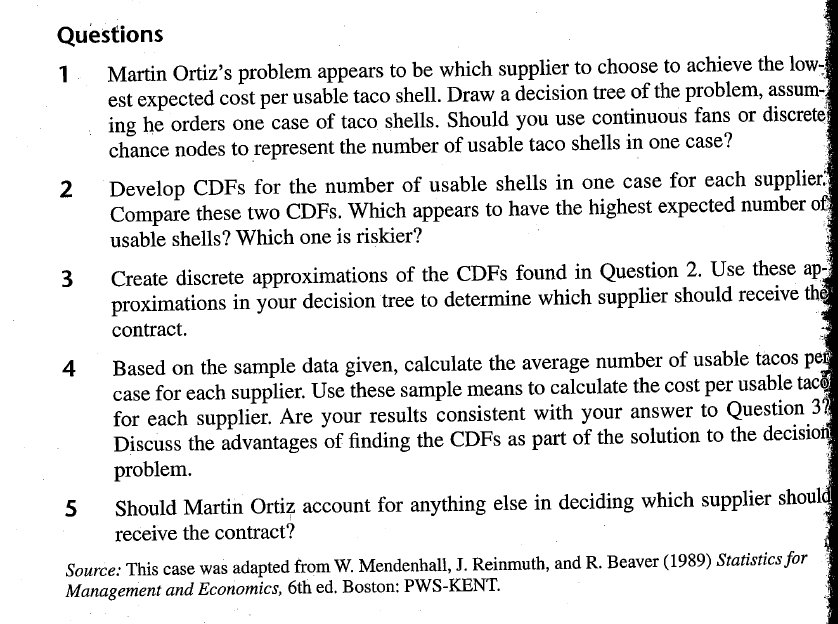
CASE STUDIES TACO SHELLS Martin Ortiz, purchasing manager for the True Taco fast food chain, was contacted by a salesperson for a food service company. The salesperson pointed out the high breakage rate that was common in the shipment of most taco shells. Martin was aware of this fact, and noted that the chain usually experienced a 10% to 15% break- age rate. The salesperson then explained that his company recently had designed a new shipping container that reduced the breakage rate to less than 5%, and he pro- duced the results of an independent test to support his claim. When Martin asked about price, the salesperson said that his company charged $25 for a case of 500 taco shells, $1.25 more than True Taco currently was paying. But the salesperson claimed that the lower breakage rate more than compensated for the higher cost, offering a lower cost per usable taco shell than the current supplier. Martin, however, felt that he should try the new product on a limited basis and de- velop his own evidence. He decided to order a dozen cases and compare the break- age rate in these 12 cases with the next shipment of 18 cases from the current sup- plier. For each case received, Martin carefully counted the number of usable shells. The results are shown below: Usable Shells New Supplier Current Supplier 468 474 474 479 482 467 469 484 470 463 468 444 449 443 440 441 434 427 446 450 444 433 441 436 429 452 439 448 442 478 Questions 1. Martin Ortiz's problem appears to be which supplier to choose to achieve the low- est expected cost per usable taco shell. Draw a decision tree of the problem, assum- ing he orders one case of taco shells. Should you use continuous fans or discrete chance nodes to represent the number of usable taco shells in one case? 2 Develop CDFs for the number of usable shells in one case for each supplier. Compare these two CDFs. Which appears to have the highest expected number of usable shells? Which one is riskier? 3 Create discrete approximations of the CDFs found in Question 2. Use these ap- proximations in your decision tree to determine which supplier should receive the contract. 4 Based on the sample data given, calculate the average number of usable tacos per case for each supplier. Use these sample means to calculate the cost per usable taco for each supplier. Are your results consistent with your answer to Question 3? Discuss the advantages of finding the CDFs as part of the solution to the decision problem. 5 Should Martin Ortiz account for anything else in deciding which supplier should receive the contract? Source: This case was adapted from W. Mendenhall, J. Reinmuth, and R. Beaver (1989) Statistics for Management and Economics, 6th ed. Boston: PWS-KENT. CASE STUDIES TACO SHELLS Martin Ortiz, purchasing manager for the True Taco fast food chain, was contacted by a salesperson for a food service company. The salesperson pointed out the high breakage rate that was common in the shipment of most taco shells. Martin was aware of this fact, and noted that the chain usually experienced a 10% to 15% break- age rate. The salesperson then explained that his company recently had designed a new shipping container that reduced the breakage rate to less than 5%, and he pro- duced the results of an independent test to support his claim. When Martin asked about price, the salesperson said that his company charged $25 for a case of 500 taco shells, $1.25 more than True Taco currently was paying. But the salesperson claimed that the lower breakage rate more than compensated for the higher cost, offering a lower cost per usable taco shell than the current supplier. Martin, however, felt that he should try the new product on a limited basis and de- velop his own evidence. He decided to order a dozen cases and compare the break- age rate in these 12 cases with the next shipment of 18 cases from the current sup- plier. For each case received, Martin carefully counted the number of usable shells. The results are shown below: Usable Shells New Supplier Current Supplier 468 474 474 479 482 467 469 484 470 463 468 444 449 443 440 441 434 427 446 450 444 433 441 436 429 452 439 448 442 478 Questions 1. Martin Ortiz's problem appears to be which supplier to choose to achieve the low- est expected cost per usable taco shell. Draw a decision tree of the problem, assum- ing he orders one case of taco shells. Should you use continuous fans or discrete chance nodes to represent the number of usable taco shells in one case? 2 Develop CDFs for the number of usable shells in one case for each supplier. Compare these two CDFs. Which appears to have the highest expected number of usable shells? Which one is riskier? 3 Create discrete approximations of the CDFs found in Question 2. Use these ap- proximations in your decision tree to determine which supplier should receive the contract. 4 Based on the sample data given, calculate the average number of usable tacos per case for each supplier. Use these sample means to calculate the cost per usable taco for each supplier. Are your results consistent with your answer to Question 3? Discuss the advantages of finding the CDFs as part of the solution to the decision problem. 5 Should Martin Ortiz account for anything else in deciding which supplier should receive the contract? Source: This case was adapted from W. Mendenhall, J. Reinmuth, and R. Beaver (1989) Statistics for Management and Economics, 6th ed. Boston: PWS-KENTStep by Step Solution
There are 3 Steps involved in it
Step: 1

Get Instant Access to Expert-Tailored Solutions
See step-by-step solutions with expert insights and AI powered tools for academic success
Step: 2

Step: 3
Ace Your Homework with AI
Get the answers you need in no time with our AI-driven, step-by-step assistance
Get Started
Murder Audit
Authors: Michelle Cornish
1st Edition
1775083624, 978-1775083627