

Answered step by step
Verified Expert Solution
Question
1 Approved Answer
CASE STUDY REPORT FORMAT GUIDELINE Case Study-1 Following is a suggested guideline for preparing your case study reports. Cover Page (Include student names and student
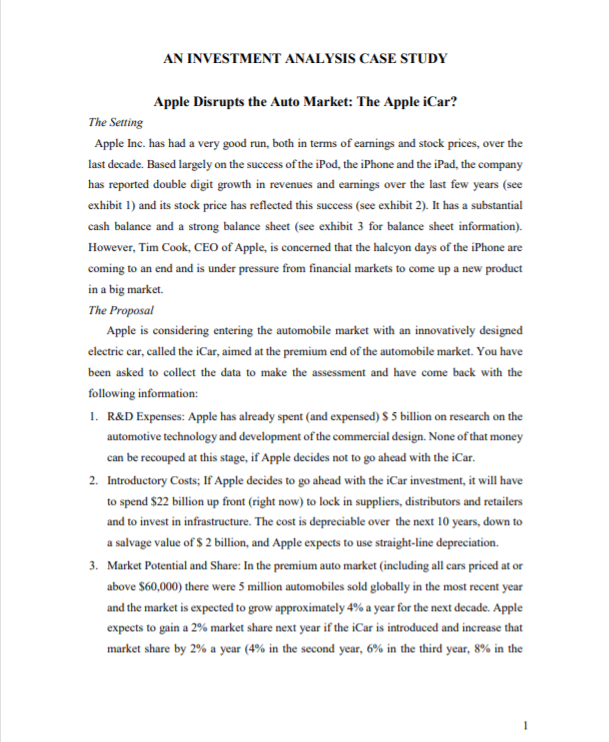
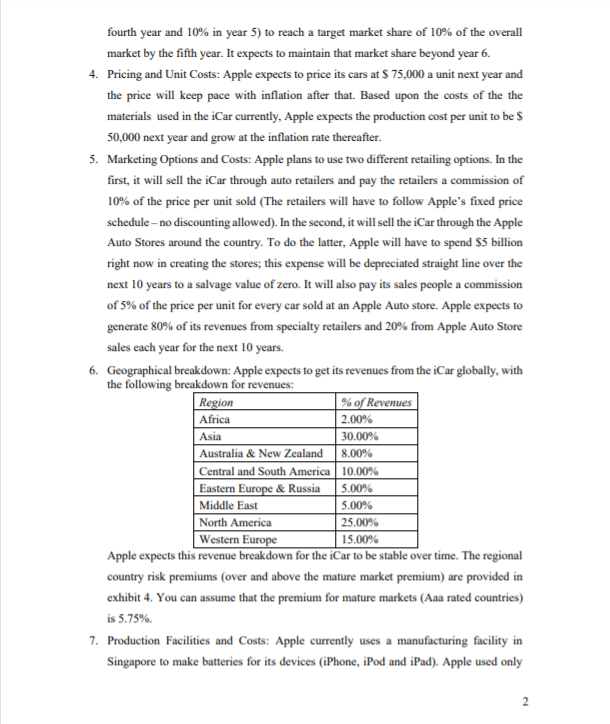
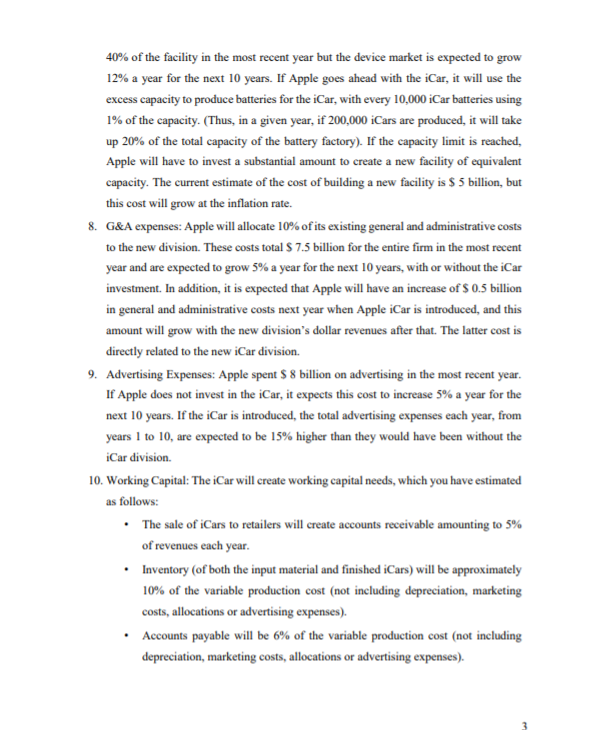
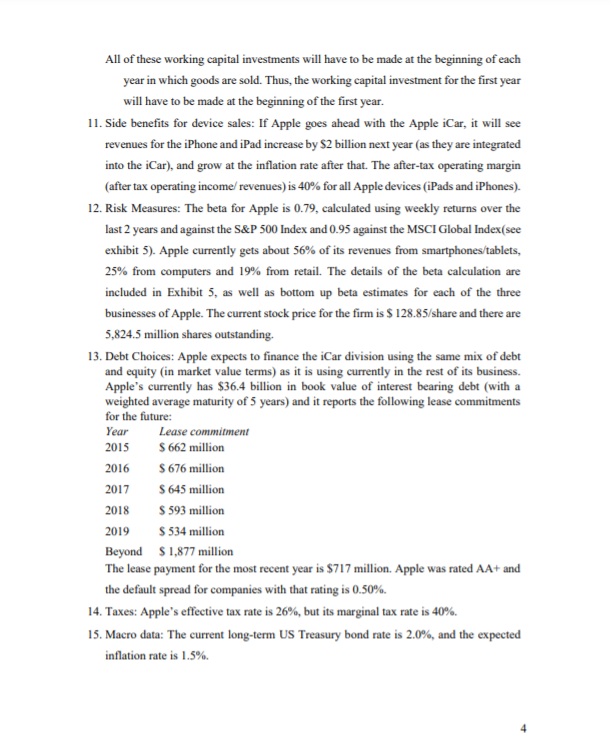
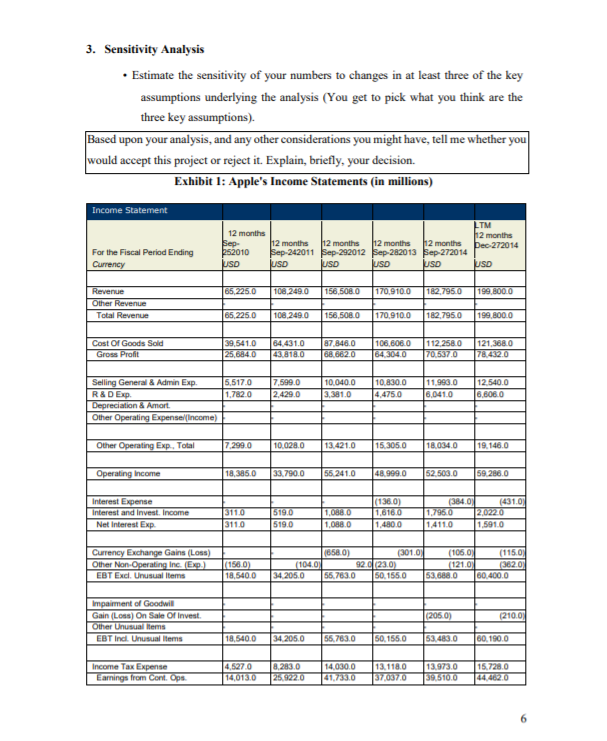
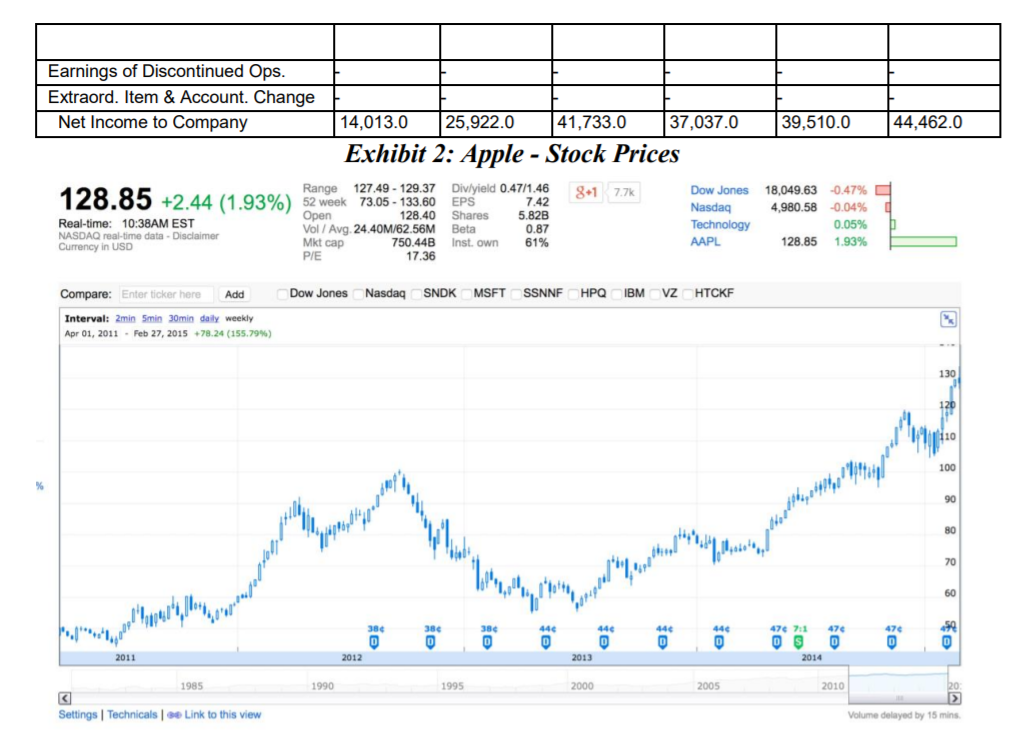
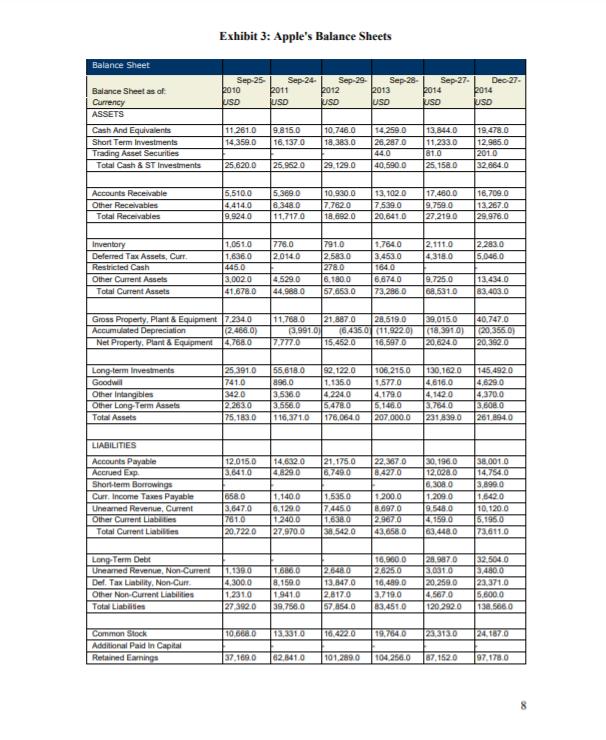
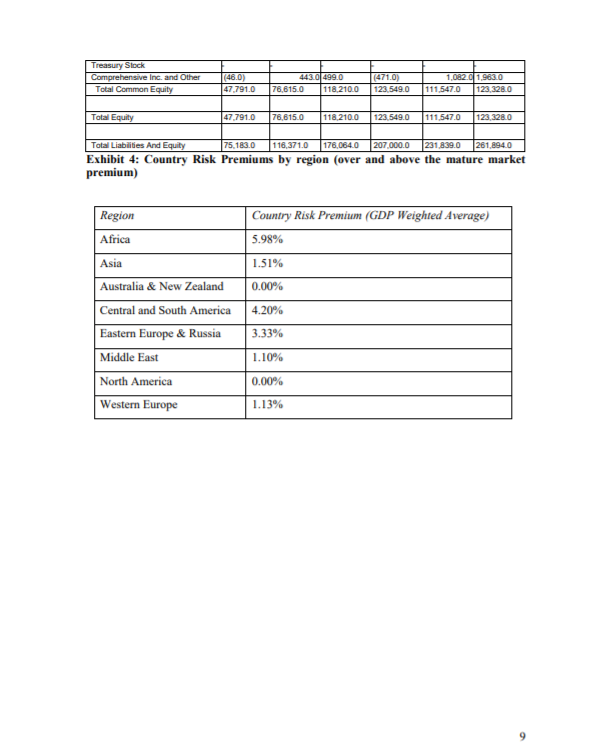
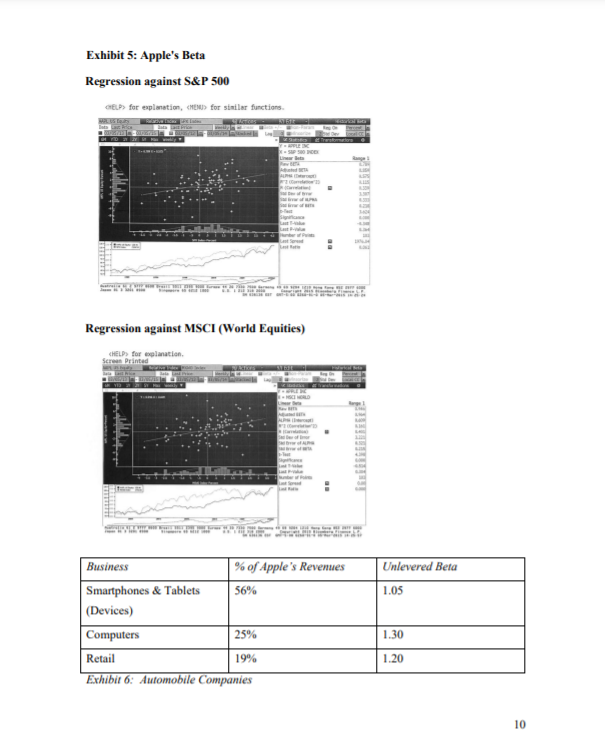
CASE STUDY REPORT FORMAT GUIDELINE Case Study-1 Following is a suggested guideline for preparing your case study reports. Cover Page (Include student names and student Ids) Executive Summary (If appropriate should be written last to focus on key points/findings) Introduction Current Situation Analysis and pertinent Background including a synopsis of the relevant information from the case analysis tool short form. Body Analysis of cases Accounting Return Analysis Cash Flow Analysis Sensitivity Analysis Key Issues Justified of Decision Criteria of cases Summary of cases Assumptions Recommendations of cases Conclusion References Recommend that you source business journals, periodicals, and textual references as well as any online research. Make sure you support your ideas with facts and figures. Please try to use your own words and ideas based on research rather than copy and paste other's words from the internet. You should USE PROPER HARVARD style in-line citations, image source citations, and an alphabetical CITATION LIST in a references section. Appendices All charts, financials, visuals, and other related items can be placed here and referenced in the report. Page no more than 15 pages AN INVESTMENT ANALYSIS CASE STUDY Apple Disrupts the Auto Market: The Apple iCar? The Setting Apple Inc. has had a very good run, both in terms of earnings and stock prices, over the last decade. Based largely on the success of the iPod, the iPhone and the iPad, the company has reported double digit growth in revenues and earnings over the last few years (see exhibit 1) and its stock price has reflected this success (see exhibit 2). It has a substantial cash balance and a strong balance sheet (see exhibit 3 for balance sheet information). However, Tim Cook, CEO of Apple, is concerned that the halcyon days of the iPhone are coming to an end and is under pressure from financial markets to come up a new product in a big market. The Proposal Apple is considering entering the automobile market with an innovatively designed electric car, called the iCar, aimed at the premium end of the automobile market. You have been asked to collect the data to make the assessment and have come back with the following information: 1. R&D Expenses: Apple has already spent (and expensed) $ 5 billion on research on the automotive technology and development of the commercial design. None of that money can be recouped at this stage, if Apple decides not to go ahead with the iCar. 2. Introductory Costs; If Apple decides to go ahead with the iCar investment, it will have to spend $22 billion up front (right now) to lock in suppliers, distributors and retailers and to invest in infrastructure. The cost is depreciable over the next 10 years, down to a salvage value of $ 2 billion, and Apple expects to use straight-line depreciation. 3. Market Potential and Share: In the premium auto market (including all cars priced at or above $60,000) there were 5 million automobiles sold globally in the most recent year and the market is expected to grow approximately 4% a year for the next decade. Apple expects to gain a 2% market share next year if the iCar is introduced and increase that market share by 2% a year (4% in the second year, 6% in the third year, 8% in the fourth year and 10% in year 5) to reach a target market share of 10% of the overall market by the fifth year. It expects to maintain that market share beyond year 6. 4. Pricing and Unit Costs: Apple expects to price its cars at $ 75,000 a unit next year and the price will keep pace with inflation after that. Based upon the costs of the the materials used in the iCar currently, Apple expects the production cost per unit to be $ 50,000 next year and grow at the inflation rate thereafter. 5. Marketing Options and Costs: Apple plans to use two different retailing options. In the first, it will sell the iCar through auto retailers and pay the retailers a commission of 10% of the price per unit sold (The retailers will have to follow Apple's fixed price schedule no discounting allowed). In the second, it will sell the iCar through the Apple Auto Stores around the country. To do the latter, Apple will have to spend $5 billion right now in creating the stores, this expense will be depreciated straight line over the next 10 years to a salvage value of zero. It will also pay its sales people a commission of 5% of the price per unit for every car sold at an Apple Auto store. Apple expects to generate 80% of its revenues from specialty retailers and 20% from Apple Auto Store sales each year for the next 10 years. 6. Geographical breakdown: Apple expects to get its revenues from the iCar globally, with the following breakdown for revenues: Region % of Revenues Africa 2.00% Asia Australia & New Zealand 8.00% Central and South America 10.00% Eastern Europe & Russia 5.00% Middle East 5.00% North America 25.00% Western Europe 15.00% Apple expects this revenue breakdown for the iCar to be stable over time. The regional country risk premiums (over and above the mature market premium) are provided in exhibit 4. You can assume that the premium for mature markets (Aaa rated countries) is 5.75% 7. Production Facilities and Costs: Apple currently uses a manufacturing facility in Singapore to make batteries for its devices (iPhone, iPod and iPad). Apple used only 30.00% 2 40% of the facility in the most recent year but the device market is expected to grow 12% a year for the next 10 years. If Apple goes ahead with the iCar, it will use the excess capacity to produce batteries for the iCar, with every 10,000 iCar batteries using 1% of the capacity. (Thus, in a given year, if 200,000 iCars are produced, it will take up 20% of the total capacity of the battery factory). If the capacity limit is reached, Apple will have to invest a substantial amount to create a new facility of equivalent capacity. The current estimate of the cost of building a new facility is $5 billion, but this cost will grow at the inflation rate. 8. G&A expenses: Apple will allocate 10% of its existing general and administrative costs to the new division. These costs total $ 7.5 billion for the entire firm in the most recent year and are expected to grow 5% a year for the next 10 years, with or without the iCar investment. In addition, it is expected that Apple will have an increase of $ 0.5 billion in general and administrative costs next year when Apple iCar is introduced, and this amount will grow with the new division's dollar revenues after that. The latter cost is directly related to the new iCar division. 9. Advertising Expenses: Apple spent $8 billion on advertising in the most recent year. If Apple does not invest in the iCar, it expects this cost to increase 5% a year for the next 10 years. If the iCar is introduced, the total advertising expenses each year, from years 1 to 10, are expected to be 15% higher than they would have been without the iCar division 10. Working Capital: The iCar will create working capital needs, which you have estimated as follows: The sale of iCars to retailers will create accounts receivable amounting to 5% of revenues each year. Inventory (of both the input material and finished iCars) will be approximately 10% of the variable production cost (not including depreciation, marketing costs, allocations or advertising expenses). Accounts payable will be 6% of the variable production cost (not including depreciation, marketing costs, allocations or advertising expenses). All of these working capital investments will have to be made at the beginning of each year in which goods are sold. Thus, the working capital investment for the first year will have to be made at the beginning of the first year. 11. Side benefits for device sales: If Apple goes ahead with the Apple iCar, it will see revenues for the iPhone and iPad increase by $2 billion next year (as they are integrated into the iCar), and grow at the inflation rate after that. The after-tax operating margin (after tax operating income revenues) is 40% for all Apple devices (iPads and iPhones). 12. Risk Measures: The beta for Apple is 0.79, calculated using weekly returns over the last 2 years and against the S&P 500 Index and 0.95 against the MSCI Global Index(see exhibit 5). Apple currently gets about 56% of its revenues from smartphones/tablets, 25% from computers and 19% from retail. The details of the beta calculation are included in Exhibit 5, as well as bottom up beta estimates for each of the three businesses of Apple. The current stock price for the firm is $ 128.85/share and there are 5,824.5 million shares outstanding. 13. Debt Choices: Apple expects to finance the iCar division using the same mix of debt and equity (in market value terms) as it is using currently in the rest of its business. Apple's currently has $36.4 billion in book value of interest bearing debt (with a weighted average maturity of 5 years) and it reports the following lease commitments for the future: Year Lease commitment 2015 $ 662 million 2016 $ 676 million $ 645 million 2018 $ 593 million 2019 $ 534 million Beyond $ 1,877 million The lease payment for the most recent year is $717 million. Apple was rated AA+ and the default spread for companies with that rating is 0.50%. 14. Taxes: Apple's effective tax rate is 26%, but its marginal tax rate is 40%. 15. Macro data: The current long-term US Treasury bond rate is 2.0%, and the expected inflation rate is 1.5%. 2017 4 16. Other information: You have collected information on other automobile companies in Exhibit 6. The data includes the regression betas of these companies and relevant information on both market values of debt, equity and cash. You can assume a 40% marginal tax rate for these firms, as well. (You can also assume that the debt includes the present value of operating leases). QUESTIONS ON THE PROJECT 1. Accounting Return Analysis Estimate the operating income from the proposed iCar investment to Apple over the next 10 years. Estimate the after-tax return on capital for the investment over the 10-year period. Based upon the after-tax return on capital, would you accept or reject this project? This will require you to make some assumptions about allocation and expensing. Make your assumptions as consistent as you can and estimate the return on capital. 2. Cash Flow Analysis Estimate the after-tax incremental cash flows from the proposed iCar investment to Apple over the next 10 years. If the project is terminated at the end of the 10th year, and both working capital and investment in other assets can be sold for book value at the end of that year, estimate the net present value of this project to Apple. Develop a net present value profile and estimate the internal rate of return for this project. If the iCar division is expected to have a life much longer than 10 years, estimate the net present value of this project, making reasonable assumptions about investments needed and cash flows. Develop a net present value profile and estimate the internal rate of return for this project. 5 3. Sensitivity Analysis Estimate the sensitivity of your numbers to changes in at least three of the key assumptions underlying the analysis (You get to pick what you think are the three key assumptions). Based upon your analysis, and any other considerations you might have, tell me whether you would accept this project or reject it. Explain, briefly, your decision. Exhibit 1: Apple's Income Statements (in millions) Income Statement TM 112 months Dec 272014 12 months Sep. 12 months 12 months 12 months 12 months 252010 Sep-242011 Sep-292012 Sep-282013 Sep-272014 USD USD USD USD USD For the Fiscal Period Ending Currency USD 65,225.0 108.249.0 156,508.0 170.910.0 162.7950 199.8000 Revenue Other Revenue Total Revenue 65.225.0 108,249.0 156,5080 170.9100 182.7950 199.8000 Cost Of Goods Sold Gross Profit 39,5410 25.684.0 64.431.0 437818.0 87.846.0 68,662.0 106,6060 64.304.0 112,258.0 70.5370 121,3680 78.432.0 7,599.0 2.429.0 10.040.0 3.381,0 10.830.0 4.475.0 11.993.0 6.0410 12.540.0 6.806.0 Selling General & Admin Exp. 5,517.0 R&D Exp. 1.7820 Depreciation & Amort. Other Operating Expense Income) Other Operating Exp. Total 7.299.0 10.028.0 13.4210 15.305.0 18.034.0 19.146.0 Operating Income 18.385.0 33.790.0 55.241.0 48.999.0 52.503.0 59.286.0 Interest Expense Interest and Invest. Income Net Interest Exp 3110 311.0 519.0 5190 1,088.0 1,088.0 (1360) 1.6760 1.480.0 (384.0) (431.01 1.7960 2.02270 14110 1.591.0 Currency Exchange Gains (Loss) Other Non-Operating Inc. Exp. EBT Excl. Unusual items (1560) 18.540.0 (658.0) (301.02 (105.01 (115.00 (1040 920123.0 (1210 (3620 34.205.0 55.783.0 50.155.0 53.688.0 60.400.0 (205.0) (210.01 Impairment of Goodwill Gain (Loss) On Sale Of Invest Other Unusual Items EBT Incl. Unusual Items 18,540.0 34.205.0 55.783.0 50.155.0 53.483.0 60.190.0 Income Tax Expense Earnings from Cont. Ops. 4.527.0 14.0130 8.283.0 26.9220 14,030.0 41.73370 13.118.0 37.037.0 13.973.0 SOETOO 15,728.0 44.462.0 6 Earnings of Discontinued Ops. Extraord. Item & Account. Change Net Income to Company 14,013.0 25,922.0 41,733.0 37,037.0 39,510.0 44,462.0 Exhibit 2: Apple - Stock Prices Range 127.49 - 129.37 Divlyield 0.47/1.46 128.85 +2.44 (1.93%) 52 week_73.05 - 133.60 8.1 7.7k Dow Jones 18,049.63 -0.47% EPS Nasdag 4.980.58 Open 128.40 Shares 5.82B -0.04% d Real-time: 10:38AM EST Vol / Avg 24.40M/62.56M Beta 0.87 Technology 0.05% NASDAQ real-time data - Disclaimer Mkt cap 750.44B Inst. own 61% AAPL 128.85 1.93% Currency in USD PIE 17.36 7.42 Compare: Enter ticker here Add Dow Jones Nasdaq SNDK MSFT SSNNF HPQ IBM VZ HTCKF Interval: 2min 5min 30min daily weekly Apr 01, 2011 - Feb 27, 2015 +78.24 (155.79%) 130 100 90 80 1,1,1 70 baca, pololle tye 60 I'lumpul, 446 440 D 2012 384 0 0 50 0 0 444 0 0 47 7.1 47 OS 0 2014 475 D 2011 2013 1985 1990 1995 2000 2005 2010 20 Settings Technicals Link to this view Volume delayed by 15 mins Exhibit 3: Apple's Balance Sheets Balance Sheet Sep-25 Sep 24 Sep 29 2010 Sep 28- Sep 27. Dec 27- 2011 2012 2013 2014 2014 USD JUSD USD USD USD USD Balance Sheet as of Currency ASSETS Cash And Equivalents Short Term Investments Trading Asset Securities Total Cash & ST Investments 11.261.0 14.359.0 9.815.0 16.137.0 10.746.0 18.383.0 14.259.0 26,287.0 44.0 40.590.0 13.844.0 11,233.0 81.0 25,158.0 19.478.0 12 965.0 2010 32.664.0 25.620.0 25.962.0 29. 129.0 Accounts Receivable Other Receivables Total Receivables 5.510.0 4,414.0 9.9240 5.369.0 6.348.0 11.717.0 10.930.0 7.7820 18,692.0 13,102.0 7.539.0 20.641.0 17.480.0 9.759.0 27.219.0 16.709.0 13.267.0 29.978.0 7780 2.014.0 12.111.0 4.3180 2.283.0 5.046.0 Inventory Deferred Tax Assets. Curr. Restricted Cash Other Current Assets Total Current Assets 1.061.0 1.6360 445.0 3.002.0 41.678.0 791.0 2.583.0 278.0 6,180.0 57.653.0 1.784.0 3,453.0 1640 6.674.0 73.286.0 4.529.0 44.9880 9.725.0 68.5310 13.434.0 83.403.0 Gross Property. Plant & Equipment 7.234.0 Accumulated Depreciation 02.466.0) Net Property. Plant & Equipment 4.700 11.7680 21.887.0 28.519.0 (3.991.01 (6,436.0 (11.5220) 7.777.0 15.452.0 16,597.0 39,015.0 (18,391.0) 20.624.0 40.747.0 (20.356.0) 20,392.0 Long-term Investments Goodwill Other Intangibles Other Long-Term Assets Total Assets 25.391.0 741.0 342.0 2.28370 75.183.0 56,6180 898.0 3.536.0 3.558,0 116,371.0 92.122.0 1.135.0 4.224.0 5.4780 176,0640 106.215.0 1.577.0 4.179.0 5.146.0 207.000.0 130.162.0 4,6160 4.1420 3.7640 231 899.0 145,4920 4.629.0 4.370.0 SOBO 261.894.0 LIABILITIES 12.015.0 3.8410 14,632.0 46.2290 21.175.0 6.7490 22.387.0 8.427.0 Accounts Payable Accrued Exp Short-term Borrowings Curr. Income Taxes Payable Unearned Revenue, Current Other Current Liabilities Total Current Liabilities 658.0 3.647.0 7810 20.722.0 1.140,0 6.129,0 1.240.0 27,970.0 1.535.0 7.445.0 1.6360 38.542.0 1.200.0 8.697.0 2.967,0 43,658.0 30.196.0 12.026.0 6.308.0 1.209.0 9.548.0 4.1590 63.4480 38.001.0 14.7540 3.899.0 1.6420 10.120.0 16.1960 73.611.0 Long-Term Debit Unearned Revenue, Non-Current Del. Tax Liability. Non-Curr Other Non-Current Liabilities Total Liabilities 1.139.0 4.3000 1.2310 27.392.0 16.0 8.150.0 1.941.0 39,758.0 12,6460 13,847.0 2,8170 57.854.0 16.960.0 27625.0 16.489.0 3.719.0 83.451.0 28.987.0 3.031.0 20.259.0 4.5670 120.292.0 32.504.0 14800 23.371.0 5.600.0 138,5660 TOOD 13.010 76.422.0 19.764.0 23.3130 124 100 Common Stock Additional Paid in Capital Retained Earnings 37.169.0 62,841.0 101.289.0 104 250.0 87.1520 97.178.0 8 Treasury Stock Comprehensive Inc. and Other Total Common Equity (40) 47,791.0 443.0| 499.0 76,615.0 118210.0 (471.0) 123,549.0 1,082.0 1.963.0 111.547.0 123,328.0 Total Equity 47,791.0 76,615.0 118,210.0 123.549.0 111.547.0 123.3280 Total Liabilities And Equity 75.183.0 116,371.0 176,064.0 207.000.0 231.839.0 261.894.0 Exhibit 4: Country Risk Premiums by region (over and above the mature market premium) Country Risk Premium (GDP Weighted Average) 5.98% 1.51% 0.00% Region Africa Asia Australia & New Zealand Central and South America Eastern Europe & Russia Middle East North America Western Europe 4.20% 3.33% 1.10% 0.00% 1.13% 9 Exhibit 5: Apple's Beta Regression against S&P 500 GELD> for explanation, HEM> for similar functions Regression against MSCI (World Equities) HELPS for lantion Screen Printed Unlevered Beta 1.05 Business % of Apple's Revenues Smartphones & Tablets 56% (Devices) Computers 25% Retail 19% Exhibit 6: Automobile Companies 1.30 1.20 10 The data includes all publicly traded automobile companies listed globally, with a market capitalization exceeding $1 billion. Click on this link to get the data in an excel spreadsheet. 11
Step by Step Solution
There are 3 Steps involved in it
Step: 1

Get Instant Access to Expert-Tailored Solutions
See step-by-step solutions with expert insights and AI powered tools for academic success
Step: 2

Step: 3
Ace Your Homework with AI
Get the answers you need in no time with our AI-driven, step-by-step assistance
Get Started
Accounting Information Systems And Internal Control
Authors: Eddy Vaassen, Roger Meuwissen, Caren Schelleman
2nd Edition
0470753951, 9780470753958