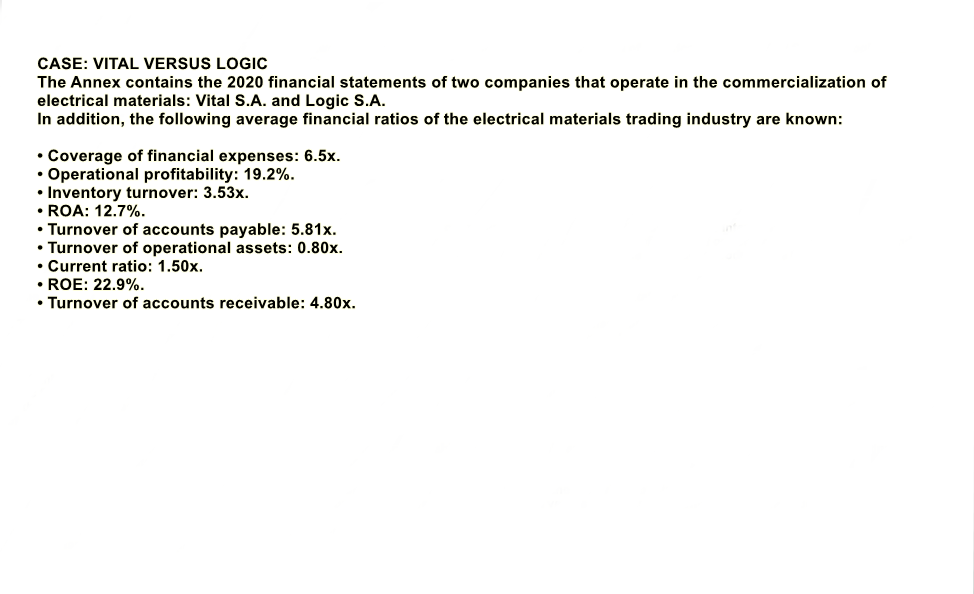
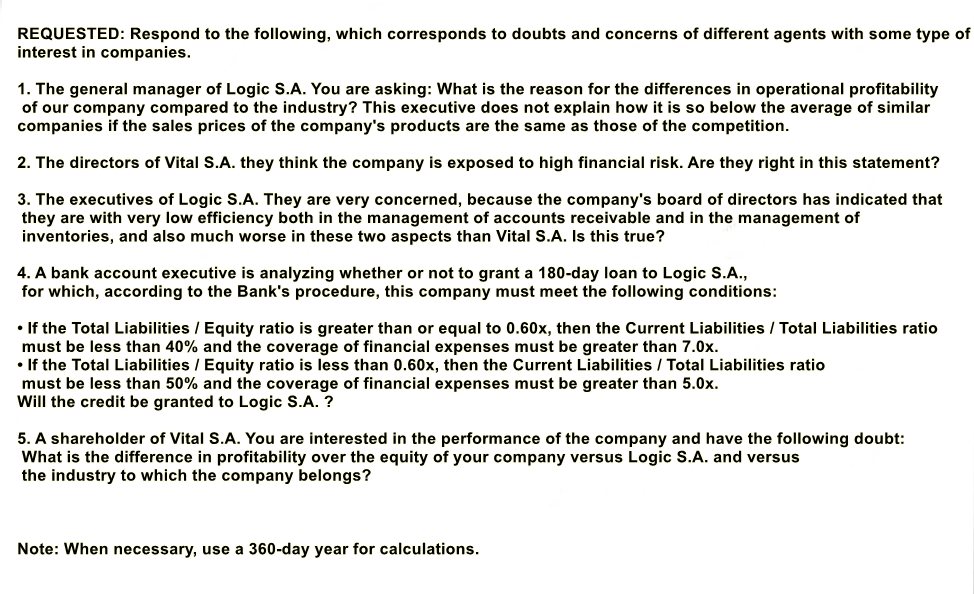
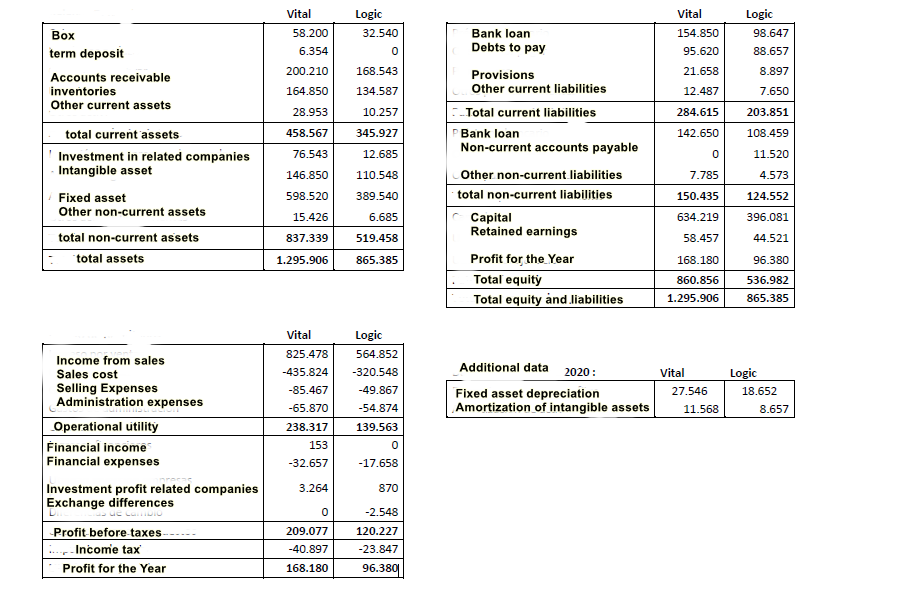
CASE: VITAL VERSUS LOGIC The Annex contains the 2020 financial statements of two companies that operate in the commercialization of electrical materials: Vital S.A. and Logic S.A. In addition, the following average financial ratios of the electrical materials trading industry are known: Coverage of financial expenses: 6.5x. Operational profitability: 19.2%. Inventory turnover: 3.53x. ROA: 12.7%. Turnover of accounts payable: 5.81x. Turnover of operational assets: 0.80x. Current ratio: 1.50x. ROE: 22.9%. Turnover of accounts receivable: 4.80x. REQUESTED: Respond to the following, which corresponds to doubts and concerns of different agents with some type of interest in companies. 1. The general manager of Logic S.A. You are asking: What is the reason for the differences in operational profitability of our company compared to the industry? This executive does not explain how it is so below the average of similar companies if the sales prices of the company's products are the same as those of the competition. 2. The directors of Vital S.A. they think the company is exposed to high financial risk. Are they right in this statement? 3. The executives of Logic S.A. They are very concerned, because the company's board of directors has indicated that they are with very low efficiency both in the management of accounts receivable and in the management of inventories, and also much worse in these two aspects than Vital S.A. Is this true? 4. A bank account executive is analyzing whether or not to grant a 180-day loan to Logic S.A., for which, according to the Bank's procedure, this company must meet the following conditions: If the Total Liabilities / Equity ratio is greater than or equal to 0.60x, then the Current Liabilities / Total Liabilities ratio must be less than 40% and the coverage of financial expenses must be greater than 7.0x. If the Total Liabilities / Equity ratio is less than 0.60x, then the Current Liabilities/Total Liabilities ratio must be less than 50% and the coverage of financial expenses must be greater than 5.0x. Will the credit be granted to Logic S.A. ? 5. A shareholder of Vital S.A. You are interested in the performance of the company and have the following doubt: What is the difference in profitability over the equity of your company versus Logic S.A. and versus the industry to which the company belongs? Note: When necessary, use a 360-day year for calculations. Vital Logic 32.540 58.200 6.354 Vital 154.850 95.620 Logic 98.647 88.657 0 Box term deposit Accounts receivable inventories Other current assets 200.210 168.543 21.658 8.897 164.850 134.587 12.487 7.650 28.953 10.257 284.615 203.851 458.567 345.927 142.650 108.459 total current assets Investment in related companies Intangible asset 76.543 12.685 0 11.520 146.850 Bank loan Debts to pay Provisions Other current liabilities Total current liabilities PBank loan Non-current accounts payable Other non-current liabilities total non-current liabilities Capital Retained earnings Profit for the Year Total equity Total equity and liabilities 7.785 4.573 110.548 389.540 598.520 150.435 124.552 15.426 6.685 634.219 396.081 Fixed asset Other non-current assets total non-current assets total assets 837.339 519.458 58.457 44.521 1.295.906 865.385 168.180 860.856 1.295.906 96.380 536.982 865.385 Vital 825.478 -435.824 -85.467 -65.870 Logic 564.852 -320.548 -49.867 -54.874 139.563 0 -17.658 Additional data 2020: Fixed asset depreciation Amortization of intangible assets Vital 27.546 11.568 Income from sales Sales cost Selling Expenses Administration expenses Operational utility Financial income Financial expenses Investment profit related companies Exchange differences Logic 18.652 8.657 238.317 153 -32.657 3.264 870 UCLID 0 -Profit before taxes Income tax Profit for the Year 209.077 -40.897 -2.548 120.227 -23.847 96.380 168.180 CASE: VITAL VERSUS LOGIC The Annex contains the 2020 financial statements of two companies that operate in the commercialization of electrical materials: Vital S.A. and Logic S.A. In addition, the following average financial ratios of the electrical materials trading industry are known: Coverage of financial expenses: 6.5x. Operational profitability: 19.2%. Inventory turnover: 3.53x. ROA: 12.7%. Turnover of accounts payable: 5.81x. Turnover of operational assets: 0.80x. Current ratio: 1.50x. ROE: 22.9%. Turnover of accounts receivable: 4.80x. REQUESTED: Respond to the following, which corresponds to doubts and concerns of different agents with some type of interest in companies. 1. The general manager of Logic S.A. You are asking: What is the reason for the differences in operational profitability of our company compared to the industry? This executive does not explain how it is so below the average of similar companies if the sales prices of the company's products are the same as those of the competition. 2. The directors of Vital S.A. they think the company is exposed to high financial risk. Are they right in this statement? 3. The executives of Logic S.A. They are very concerned, because the company's board of directors has indicated that they are with very low efficiency both in the management of accounts receivable and in the management of inventories, and also much worse in these two aspects than Vital S.A. Is this true? 4. A bank account executive is analyzing whether or not to grant a 180-day loan to Logic S.A., for which, according to the Bank's procedure, this company must meet the following conditions: If the Total Liabilities / Equity ratio is greater than or equal to 0.60x, then the Current Liabilities / Total Liabilities ratio must be less than 40% and the coverage of financial expenses must be greater than 7.0x. If the Total Liabilities / Equity ratio is less than 0.60x, then the Current Liabilities/Total Liabilities ratio must be less than 50% and the coverage of financial expenses must be greater than 5.0x. Will the credit be granted to Logic S.A. ? 5. A shareholder of Vital S.A. You are interested in the performance of the company and have the following doubt: What is the difference in profitability over the equity of your company versus Logic S.A. and versus the industry to which the company belongs? Note: When necessary, use a 360-day year for calculations. Vital Logic 32.540 58.200 6.354 Vital 154.850 95.620 Logic 98.647 88.657 0 Box term deposit Accounts receivable inventories Other current assets 200.210 168.543 21.658 8.897 164.850 134.587 12.487 7.650 28.953 10.257 284.615 203.851 458.567 345.927 142.650 108.459 total current assets Investment in related companies Intangible asset 76.543 12.685 0 11.520 146.850 Bank loan Debts to pay Provisions Other current liabilities Total current liabilities PBank loan Non-current accounts payable Other non-current liabilities total non-current liabilities Capital Retained earnings Profit for the Year Total equity Total equity and liabilities 7.785 4.573 110.548 389.540 598.520 150.435 124.552 15.426 6.685 634.219 396.081 Fixed asset Other non-current assets total non-current assets total assets 837.339 519.458 58.457 44.521 1.295.906 865.385 168.180 860.856 1.295.906 96.380 536.982 865.385 Vital 825.478 -435.824 -85.467 -65.870 Logic 564.852 -320.548 -49.867 -54.874 139.563 0 -17.658 Additional data 2020: Fixed asset depreciation Amortization of intangible assets Vital 27.546 11.568 Income from sales Sales cost Selling Expenses Administration expenses Operational utility Financial income Financial expenses Investment profit related companies Exchange differences Logic 18.652 8.657 238.317 153 -32.657 3.264 870 UCLID 0 -Profit before taxes Income tax Profit for the Year 209.077 -40.897 -2.548 120.227 -23.847 96.380 168.180