Question
Casey Byron is the owner of Inception Workspace, a collaborative office building where individuals, startups, or small businesses can reserve work spaces. Casey needs to
Casey Byron is the owner of Inception Workspace, a collaborative office building where individuals, startups, or small businesses can reserve work spaces. Casey needs to secure a loan to renovate the office, so he is preparing some charts that represent Inception Workspace’s finances to use in his loan applications.
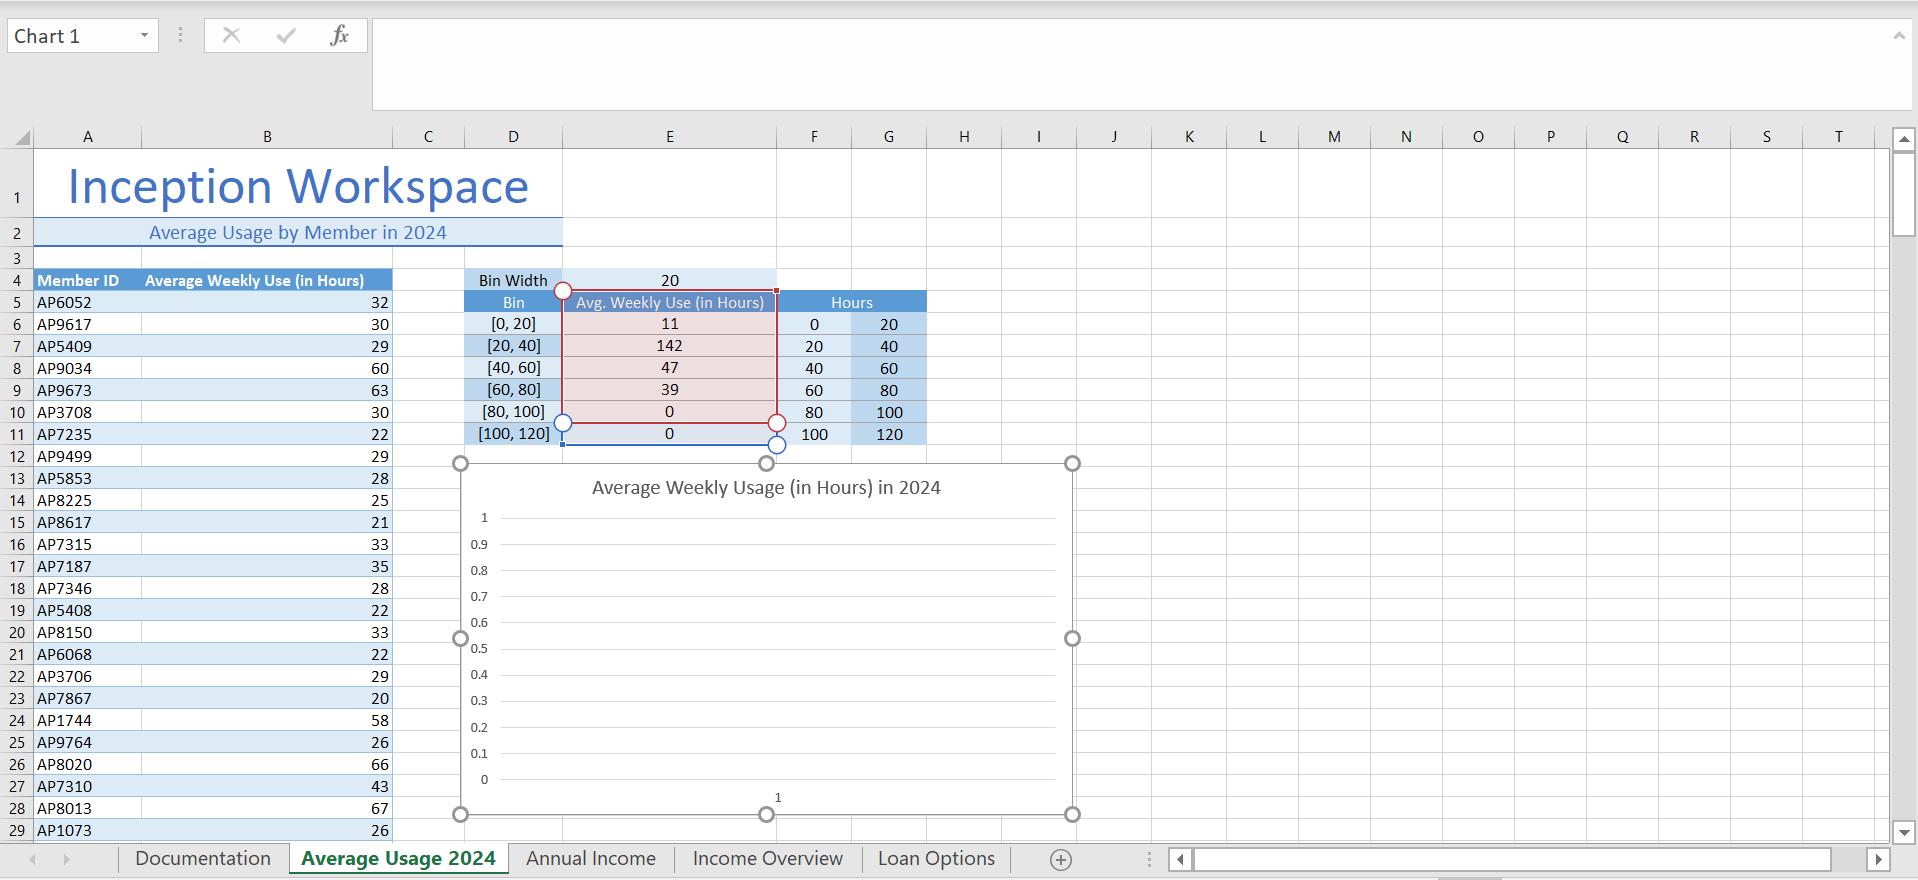
Casey wants a chart representing the distribution of average hours per week that members utilized Inception Workspace in 2024. Switch to the Average Usage 2024 worksheet. Select the range A4:B243 and create a Histogram chart. (Hint: Use the Name box to select the range.) Modify the chart as described below:
Resize and reposition the chart so that the upper-left corner is located within cell D4 and the lower-right corner is located within cell K18.
Enter Average Weekly Usage (in Hours) in 2024 as the title of the chart.
Modify the bins used in the chart by setting the Bin Width axis option to 10.
2. Inception Workspace offers a variety of membership packages to fit the needs and budgets of its customers. Casey wants to graphically represent how those packages impacted Inception Workspace’s total annual income between 2019 and 2024.
Switch to the Annual Income worksheet. Insert Column sparklines into the range H5:H10 based on the data in the range B5:G10, and then apply the Green, Accent 6, Darker 25% sparkline color.
3. Apply a Solid Fill, Green Data Bar conditional formatting rule into the range I5:I10.
4. Casey wants a pie chart representing how each membership package contributed to the Inception Workspace’s total annual income in 2019.
Select the range A5:B9, and then create a 2-D Pie chart. Modify the chart as described below:
Resize and reposition the chart so that the upper-left corner is located within cell K1 and the lower-right corner is located within cell Q13.
Enter 2019 Total Annual Income by Package as the chart title.
Apply the Style 6 chart style.
Chart 1 fr A B E G H K M N R Inception Workspace 1 Average Usage by Member in 2024 3 4 Member ID Average Weekly Use (in Hours) Bin Width 20 6052 32 Bin Avg. Weekly Use (in Hours) Hours [0, 20] [20, 40] [40, 60] [60, 80] AP9617 30 11 20 7 AP5409 29 142 20 40 8 AP9034 9 AP9673 60 47 40 60 63 39 60 80 10 AP3708 [80, 100] [100, 120] 30 80 100 11 AP7235 22 100 120 12 AP9499 29 13 AP5853 14 AP8225 28 Average Weekly Usage (in Hours) in 2024 25 15 AP8617 21 1 16 AP7315 33 0.9 17 AP7187 35 0.8 18 AP7346 28 0.7 19 AP5408 22 0.6 20 AP8150 33 0.5 21 AP6068 22 22 AP3706 29 0.4 23 AP7867 20 0.3 24 AP1744 58 0.2 25 AP9764 26 0.1 26 AP8020 27 AP7310 66 43 28 AP8013 29 AP1073 67 26 Documentation Average Usage 2024 Annual Income Income Overview Loan Options
Step by Step Solution
3.40 Rating (153 Votes )
There are 3 Steps involved in it
Step: 1
New Perspectives Excel 2016 Module 4 SAM Project la Final Figure 1 Average Usage 2024 Worksheet Rang...
Get Instant Access to Expert-Tailored Solutions
See step-by-step solutions with expert insights and AI powered tools for academic success
Step: 2

Step: 3

Ace Your Homework with AI
Get the answers you need in no time with our AI-driven, step-by-step assistance
Get Started


