Answered step by step
Verified Expert Solution
Question
1 Approved Answer
Cash A/R Inventories Total CA Gross FA Less: Dep. Net FA Total Assets 2018 7,282 632,160 1,287,360 1,926,802 1,202,950 263,160 939,790 2,866,592 2017 57,600 351,200
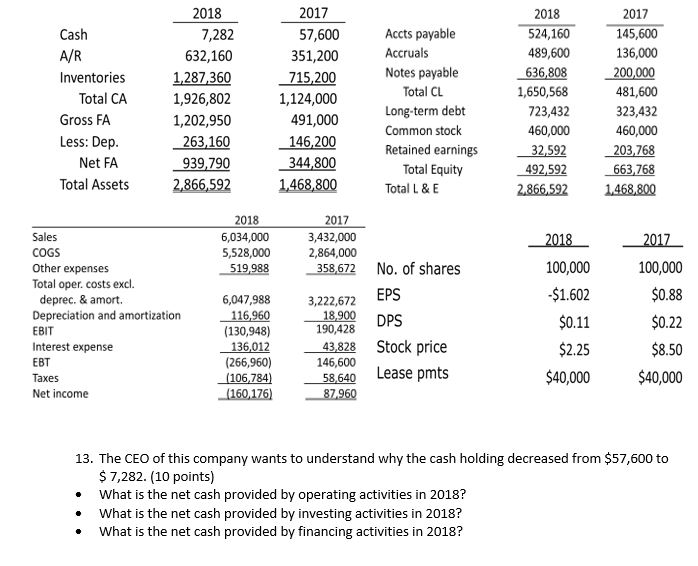
Cash A/R Inventories Total CA Gross FA Less: Dep. Net FA Total Assets 2018 7,282 632,160 1,287,360 1,926,802 1,202,950 263,160 939,790 2,866,592 2017 57,600 351,200 715,200 1,124,000 491,000 146,200 344,800 1,468,800 Accts payable Accruals Notes payable Total CL Long-term debt Common stock Retained earnings Total Equity Total L & E 2018 524,160 489,600 636.808 1,650,568 723,432 460,000 32,592 492,592 2.866,592 2017 145,600 136,000 200,000 481,600 323,432 460,000 203,768 663,768 1.468,800 2017 2018 6,034,000 5,528,000 519,988 2017 3,432,000 2,864,000 358,672 No. of shares Sales COGS Other expenses Total oper. costs excl. deprec. & amort. Depreciation and amortization EBIT Interest expense 3,222,672 EPS 2018 100,000 -$1.602 $0.11 $2.25 $40,000 6,047,988 116,960 (130,948) 136,012 (266,960) (106,784) (160,176) DPS 18,900 190,428 43,828 146,600 58,640 87,960 100,000 $0.88 $0.22 $8.50 $40,000 EBT Stock price Lease pmts Taxes Net income 13. The CEO of this company wants to understand why the cash holding decreased from $57,600 to $ 7,282. (10 points) What is the net cash provided by operating activities in 2018? What is the net cash provided by investing activities in 2018? What is the net cash provided by financing activities in 2018
Step by Step Solution
There are 3 Steps involved in it
Step: 1
Get Instant Access to Expert-Tailored Solutions
See step-by-step solutions with expert insights and AI powered tools for academic success
Step: 2
Step: 3
Ace Your Homework with AI
Get the answers you need in no time with our AI-driven, step-by-step assistance
Get Started