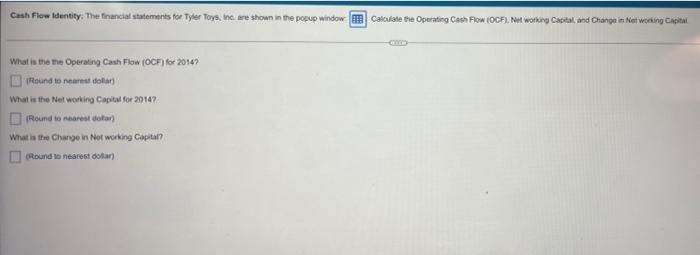
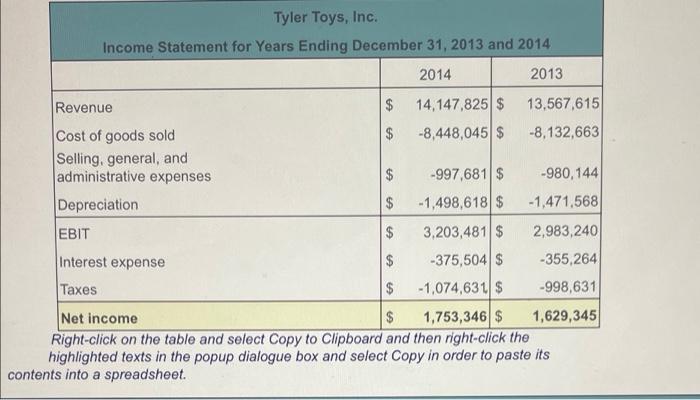
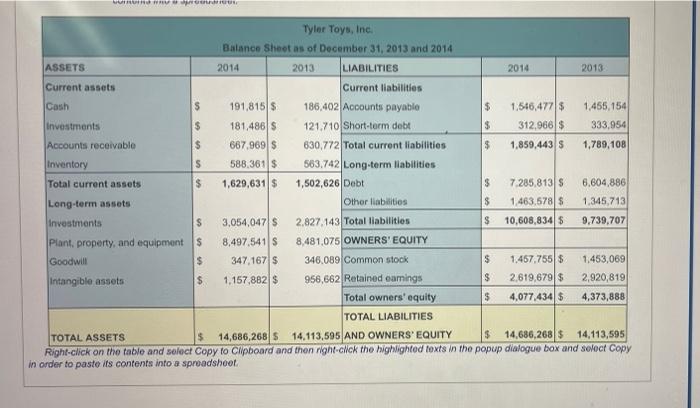
Cash Flow Identity: The financial statements for Tyler Toys, Inc. are shown in the popup window Calculate the Operating Cash Flow (OCF), Net working Capital and Change in Not working Capital D What is the the Operating Cash Flow (OCF) for 2014? (Round to nearest dollar) What is the Net working Capital for 2014? (Round to nearest dolar) What is the Change in Not working Capital? (Round to nearest dollar) Tyler Toys, Inc. Income Statement for Years Ending December 31, 2013 and 2014 2014 2013 Revenue $ 14,147,825 $ 13,567,615 Cost of goods sold $ -8,448,045 $ -8,132,663 Selling, general, and administrative expenses $ -997,681 $ -980, 144 Depreciation $ -1,498,618 $ -1,471,568 EBIT $ 3,203,481 $ 2,983,240 Interest expense $ -375,504 $ -355,264 Taxes $ -1,074,631 $ -998,631 Net income $ 1,753,346 $ 1,629,345 Right-click on the table and select Copy to Clipboard and then right-click the highlighted texts in the popup dialogue box and select Copy in order to paste its contents into a spreadsheet. Gr Tyler Toys, Inc. Balance Sheet as of December 31, 2013 and 2014 ASSETS 2014 2013 LIABILITIES 2014 2013 Current assets Current liabilities Cash 191,815 $ 186,402 Accounts payable $ 1,546,477 $ 1,455,154 Investments 181,486 S 121,710 Short-term debt $ 312,966 $ 333,954 Accounts receivable 667,969 $ 630,772 Total current liabilities $ 1,859,443 S 1,789,108 Inventory 588,361 $ 563,742 Long-term liabilities Total current assets 1,629,631 $ 1,502,626 Debt $ 7,285,813 S 6,604,886 Long-term assets Other liabilities $ 1,463,578 $ 1,345,713) Investments 3,054,047 $ 2.827,143 Total liabilities $ 10,608,834 $ 9,739,707 8,497,541 S 8,481,075 OWNERS' EQUITY Plant, property, and equipment Goodwill 347,167 $ 346,089 Common stock $ 1,457,755 $ 1,453,069 Intangible assets 1,157,882 $ 956,662 Retained earings $ 2,619,679 $ 2,920,819 $ 4,077,434 $ 4,373,888 Total owners' equity TOTAL LIABILITIES TOTAL ASSETS $ 14,686,268 S 14,113,595 AND OWNERS' EQUITY $ 14,686,268 $ 14,113,595 Right-click on the table and select Copy to Clipboard and then right-click the highlighted texts in the popup dialogue box and select Copy in order to paste its contents into a spreadsheet. $ $ $ S $ $ $ $ 15 $ Cash Flow Identity: The financial statements for Tyler Toys, Inc. are shown in the popup window Calculate the Operating Cash Flow (OCF), Net working Capital and Change in Not working Capital D What is the the Operating Cash Flow (OCF) for 2014? (Round to nearest dollar) What is the Net working Capital for 2014? (Round to nearest dolar) What is the Change in Not working Capital? (Round to nearest dollar) Tyler Toys, Inc. Income Statement for Years Ending December 31, 2013 and 2014 2014 2013 Revenue $ 14,147,825 $ 13,567,615 Cost of goods sold $ -8,448,045 $ -8,132,663 Selling, general, and administrative expenses $ -997,681 $ -980, 144 Depreciation $ -1,498,618 $ -1,471,568 EBIT $ 3,203,481 $ 2,983,240 Interest expense $ -375,504 $ -355,264 Taxes $ -1,074,631 $ -998,631 Net income $ 1,753,346 $ 1,629,345 Right-click on the table and select Copy to Clipboard and then right-click the highlighted texts in the popup dialogue box and select Copy in order to paste its contents into a spreadsheet. Gr Tyler Toys, Inc. Balance Sheet as of December 31, 2013 and 2014 ASSETS 2014 2013 LIABILITIES 2014 2013 Current assets Current liabilities Cash 191,815 $ 186,402 Accounts payable $ 1,546,477 $ 1,455,154 Investments 181,486 S 121,710 Short-term debt $ 312,966 $ 333,954 Accounts receivable 667,969 $ 630,772 Total current liabilities $ 1,859,443 S 1,789,108 Inventory 588,361 $ 563,742 Long-term liabilities Total current assets 1,629,631 $ 1,502,626 Debt $ 7,285,813 S 6,604,886 Long-term assets Other liabilities $ 1,463,578 $ 1,345,713) Investments 3,054,047 $ 2.827,143 Total liabilities $ 10,608,834 $ 9,739,707 8,497,541 S 8,481,075 OWNERS' EQUITY Plant, property, and equipment Goodwill 347,167 $ 346,089 Common stock $ 1,457,755 $ 1,453,069 Intangible assets 1,157,882 $ 956,662 Retained earings $ 2,619,679 $ 2,920,819 $ 4,077,434 $ 4,373,888 Total owners' equity TOTAL LIABILITIES TOTAL ASSETS $ 14,686,268 S 14,113,595 AND OWNERS' EQUITY $ 14,686,268 $ 14,113,595 Right-click on the table and select Copy to Clipboard and then right-click the highlighted texts in the popup dialogue box and select Copy in order to paste its contents into a spreadsheet. $ $ $ S $ $ $ $ 15 $


