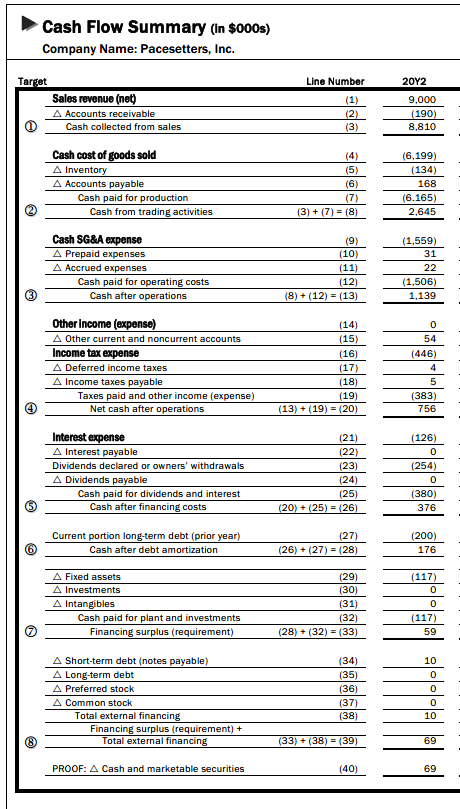
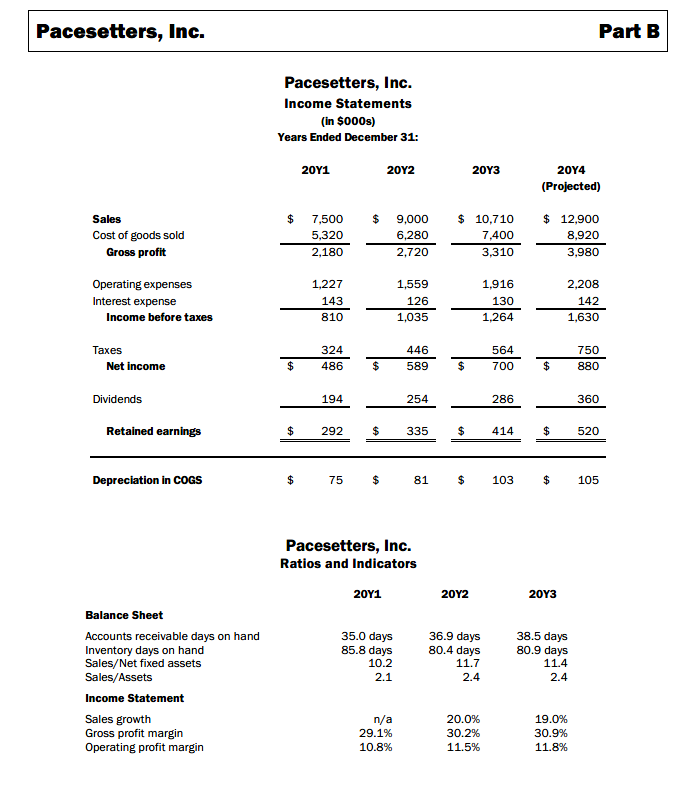
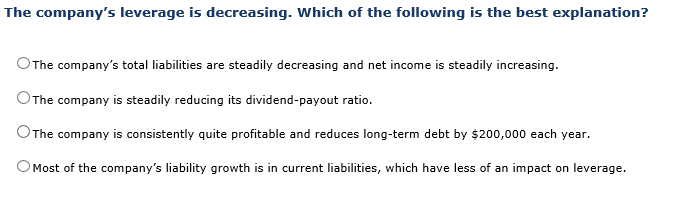
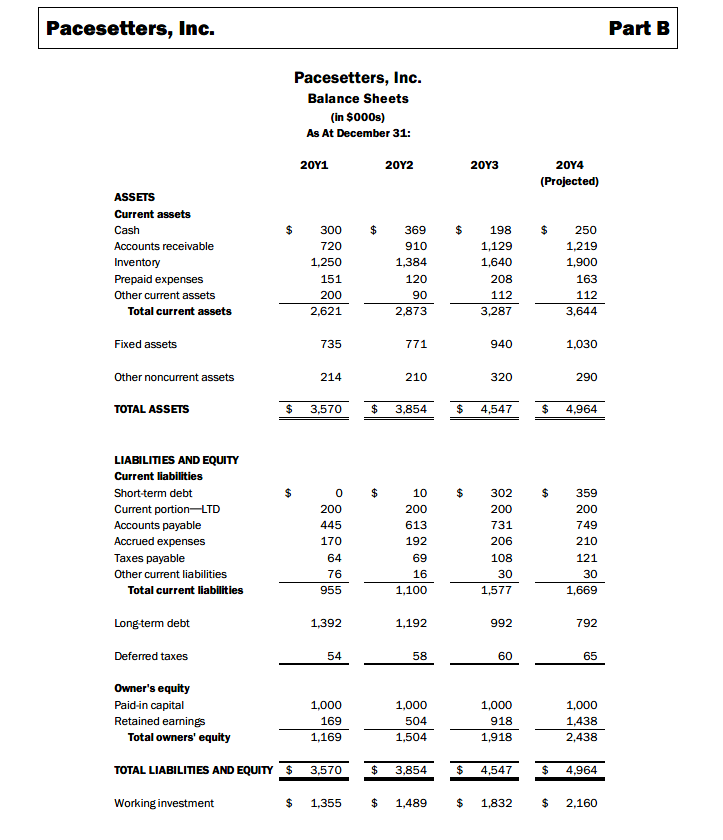
Cash Flow Summary (in $000s) Company Name: Pacesetters, Inc. Target Line Number 20Y2 Sales revenue (net) A Accounts receivable (1) (2) (3) 9,000 (190) 8,810 Cash collected from sales Cash cost of goods sold (4) (6,199) A Inventory A Accounts payable (5) (134) (6) 168 Cash paid for production (7) (6.165) Cash from trading activities (3) + (7) (8) 2,645 Cash SG&A expense (9) (10) (1,559) A Prepaid expenses A Accrued expenses 31 (11) 22 Cash paid for operating costs Cash after operations (1,506) 1,139 (12) (8)+(12) (13) Other income (expense) (14) 0 A 0ther current and noncurrent accounts (15) 54 Income tax expense (446) (16) A Deferred income taxes (17) 4 A Income taxes payable Taxes paid and other income (expense) Net cash after operations (18) 5 (19) (13)(19) (20) (383) 756 Interest expense (21) (126) AInterest payable (22) 0 Dividends declared or owners' withdrawals (23) (254) A Dividends payable Cash paid for dividends and interest Cash after financing costs (24) 0 (25) (380) (20)(25) (26) 376 Current portion long-term debt (prior year) (27) (200) Cash after debt amortization (26)(27) (28) 176 (29) (30) A Fixed assets (117) A Investments 0 A Intangibles (31) 0 Cash paid for plant and investments (32) (117 Financing surplus (requirement) (28) (32) (33) 59 A Short-term debt (notes payable) (34) 10 A Long-term debt (35) A Preferred stock (36) 0 A Common stock (37) (38) 0 Total external financing 10 Financing surplus (requirement)+ Total external financing (33)+(38) (39) 69 PROOF: A Cash and marketable securities (40) 69 Pacesetters, Inc. Part B Pacesetters, Inc. Income Statements (in $000s) Years Ended December 31: 201 202 20Y3 20Y4 (Projected) $ 12,900 Sales 7,500 9,000 10,710 5,320 Cost of goods sold 6,280 7,400 8,920 Gross profit 2,720 3,980 2,180 3,310 Operating expenses 2,208 1,227 1,559 1,916 Interest expense 143 126 130 142 Income before taxes 810 1,035 1,264 1,630 324 750 Taxes 446 564 $ $ Net income 486 589 700 880 Dividends 194 254 286 360 520 Retained earnings 292 414 335 $ $ 103 $ Depreciation in COGS 75 81 105 Pacesetters, Inc. Ratios and Indicators 202 20Y1 203 Balance Sheet 35.0 days 85.8 days 36.9 days 80.4 days Accounts receivable days on hand Inventory days on hand Sales/Net fixed assets Sales/Assets 38.5 days 80.9 days 10.2 11.7 11.4 2.1 2.4 2.4 Income Statement Sales growth Gross profit margin Operating profit margin n/a 20.0% 19.0% 30.2 % 29.1% 30.9% 10.8% 11.5% 11.8% The company's leverage is decreasing. Which of the following is the best explanation? OThe company's total liabilities are steadily decreasing and net income is steadily increasing. OThe company is steadily reducing its dividend-payout ratio OThe company is consistently quite profitable and reduces long-term debt by $200,000 each year OMost of the company's liability growth is in current liabilities, which have less of an impact on leverage Pacesetters, Inc. Part B Pacesetters, Inc. Balance Sheets (in $000s) As At December 31 202 201 203 20Y4 (Projected) ASSETS Current assets $ $ $ $ Cash 300 369 198 250 720 Accounts receivable 910 1,129 1,219 1,250 Inventory 1,384 1,640 1,900 Prepaid expenses 151 163 120 208 Other current assets 200 90 112 112 Total current assets 2,621 2,873 3,287 3,644 Fixed assets 771 940 735 1,030 210 Other noncurrent assets 214 320 290 $ $ $ TOTAL ASSETS 3,570 3,854 4,547 4,964 LIABILITIES AND EQUITY Current liabilities $ $ Short-term debt 10 302 359 Current portion-LTD 200 200 200 200 Accounts payable 445 613 731 749 Accrued expenses 170 206 192 210 Taxes payable 64 69 108 121 Other current liabilities 76 16 30 30 1,100 Total current liabilities 955 1,577 1,669 Long-term debt 1,392 1,192 992 792 Deferred taxes 54 58 60 65 Owner's equity Paid-in capital Retained earnings Total owners' equity 1,000 1,000 1,000 1,000 918 169 504 1,438 1,169 1,504 1,918 2,438 TOTAL LIABILITIES AND EQUITY $ $ 4,547 3,570 3,854 4,964 $ $ $ Working investment 1,355 1,489 1,832 2,160