

Question
.Ceramic Structures has experienced rapid growth over the past several years. Sales are expected to grow at 15% per year for the next three years.
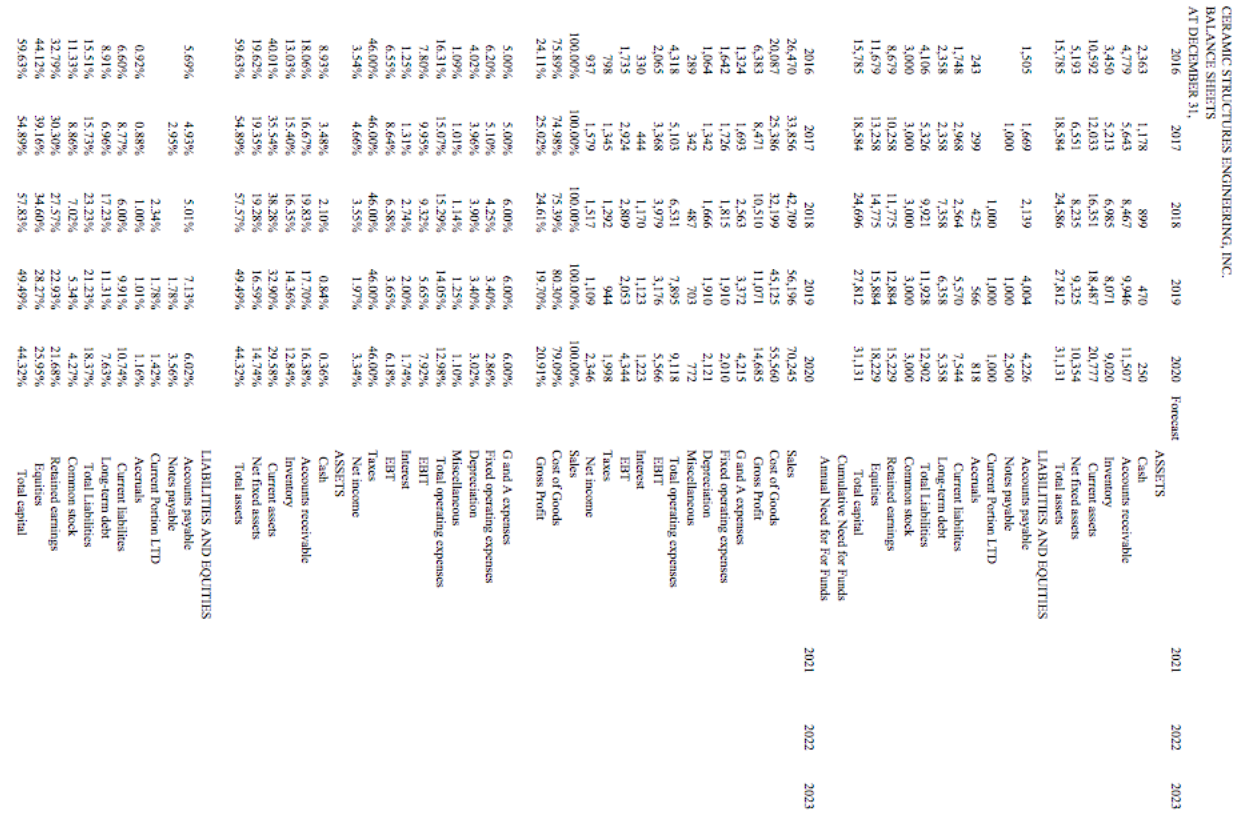
.Ceramic Structures has experienced rapid growth over the past several years. Sales are expected to grow at 15% per year for the next three years. Sales growth has been fueled by aggressive pricing as well as increased use of ceramics in high performance engines. Asset growth has been financed by internal funds as well as the increased use of debt. At the end of 2018, the debt was restructured with a new 10% seven-year loan with principal payments of $1 million per year. In addition a $1.5 million working capital line was negotiated in 2017. It was increased to $2.5 million in 2019 and $3.5 million in 2020. Interest is charged at prime + 1%. (We will use 9%.)
Cash balances will be kept around $250,000 and the credit line will average $2 million.
- Prepare pro-forma statements for Ceramic and determine their need for funds for the years 2021-2023.
- Why is there a need for funds when Ceramic is generating a profit?
- If expected sales growth fell to 8% per year, what would be Ceramic's need for funds?
- What would happen to Ceramic's need for funds if accounts receivable increased to 25% of sales?

Step by Step Solution
There are 3 Steps involved in it
Step: 1

Get Instant Access to Expert-Tailored Solutions
See step-by-step solutions with expert insights and AI powered tools for academic success
Step: 2

Step: 3
Ace Your Homework with AI
Get the answers you need in no time with our AI-driven, step-by-step assistance
Get Started
Quantitative Investment Analysis
Authors: Richard A. DeFusco, Dennis W. McLeavey, Jerald E. Pinto, David E. Runkle
3rd edition
111910422X, 978-1119104544, 1119104548, 978-1119104223