

Answered step by step
Verified Expert Solution
Question
1 Approved Answer
Ch 05- Exploring Finance Visualizations - Compounding The blue curve depicts the change in the future value of $1 with compound interest. Move the slider
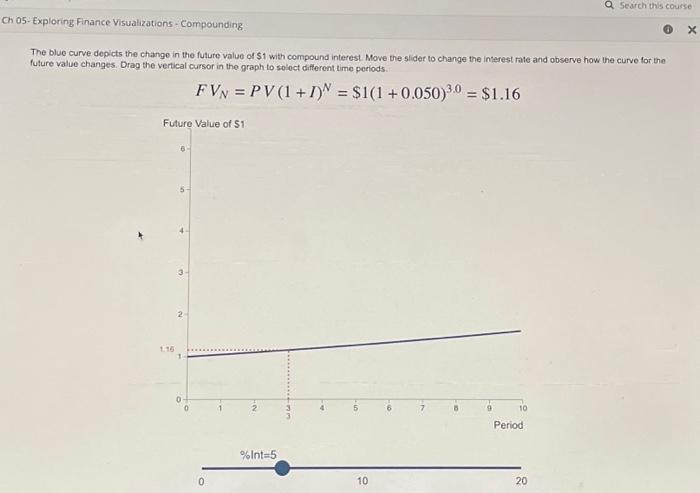
Ch 05- Exploring Finance Visualizations - Compounding The blue curve depicts the change in the future value of $1 with compound interest. Move the slider to change the interest rate and observe how the curve for the future value changes. Drag the vertical cursor in the graph to select different time periods. FVN = PV (1+1) = $1(1+0.050)3.0 = $1.16 Future Value of $1 6 5 4 3- 2- 1.16 1 0 0 0 2 %Int=5 3 10 6 7 8 9 10 Period Q Search this course 20 X
Step by Step Solution
There are 3 Steps involved in it
Step: 1

Get Instant Access to Expert-Tailored Solutions
See step-by-step solutions with expert insights and AI powered tools for academic success
Step: 2

Step: 3
Ace Your Homework with AI
Get the answers you need in no time with our AI-driven, step-by-step assistance
Get Started
Applied Equity Analysis and Portfolio Management Tools to Analyze and Manage Your Stock Portfolio
Authors: Robert A.Weigand
1st edition
978-111863091, 1118630912, 978-1118630914