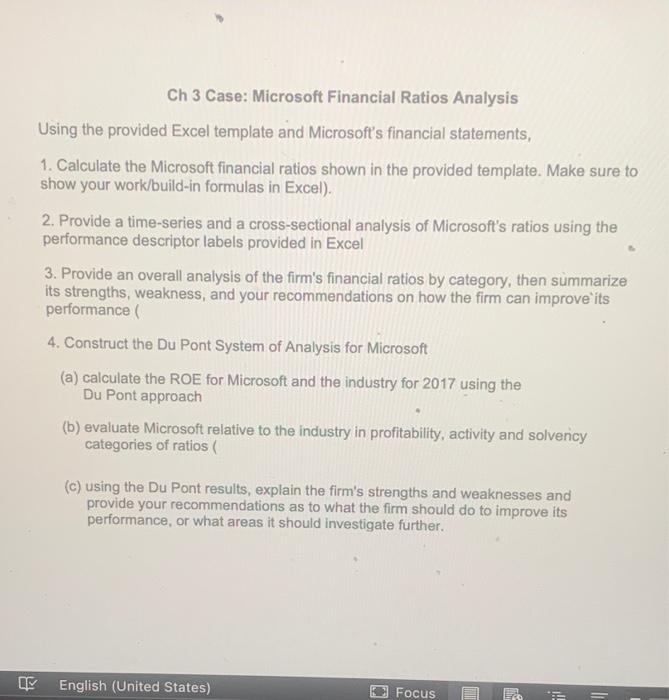
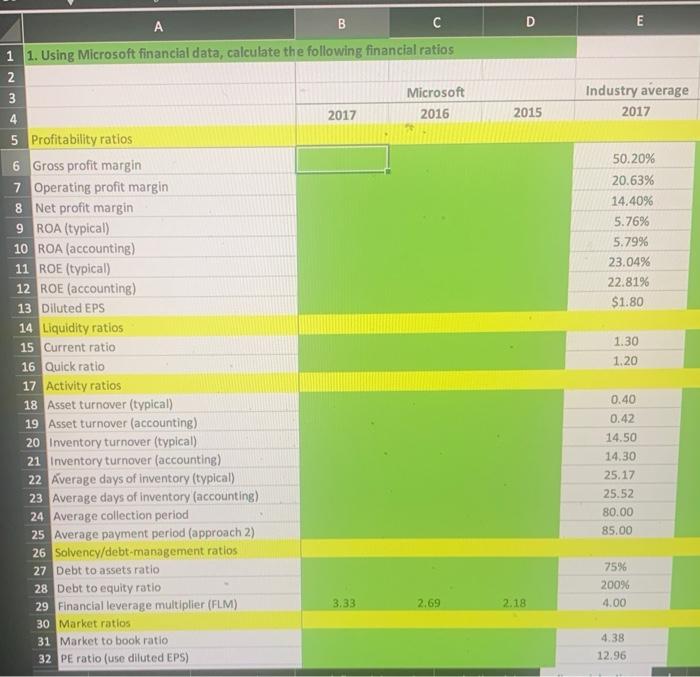
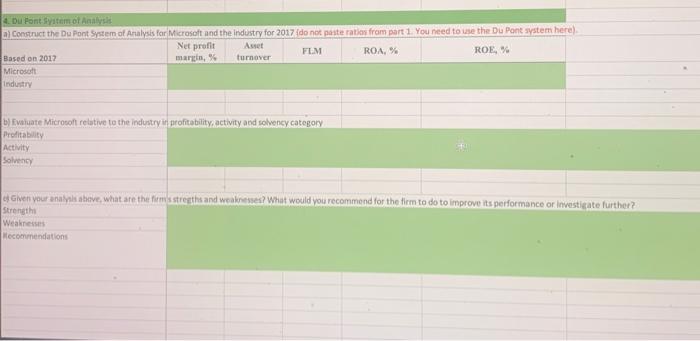
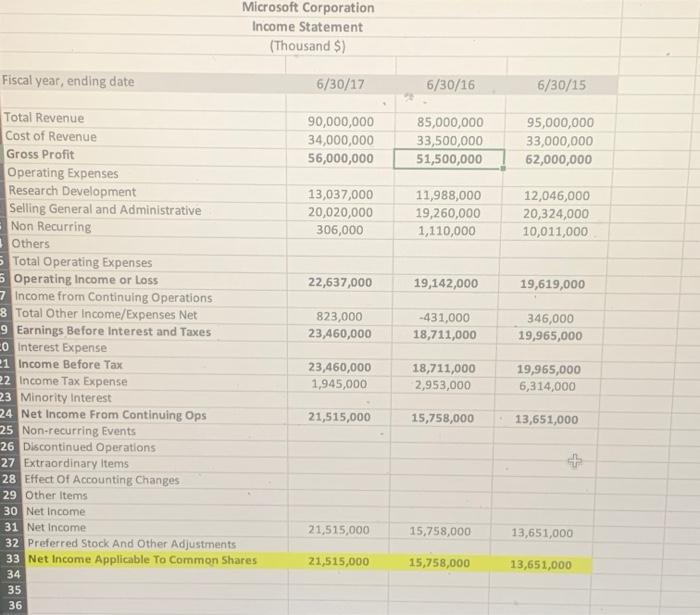
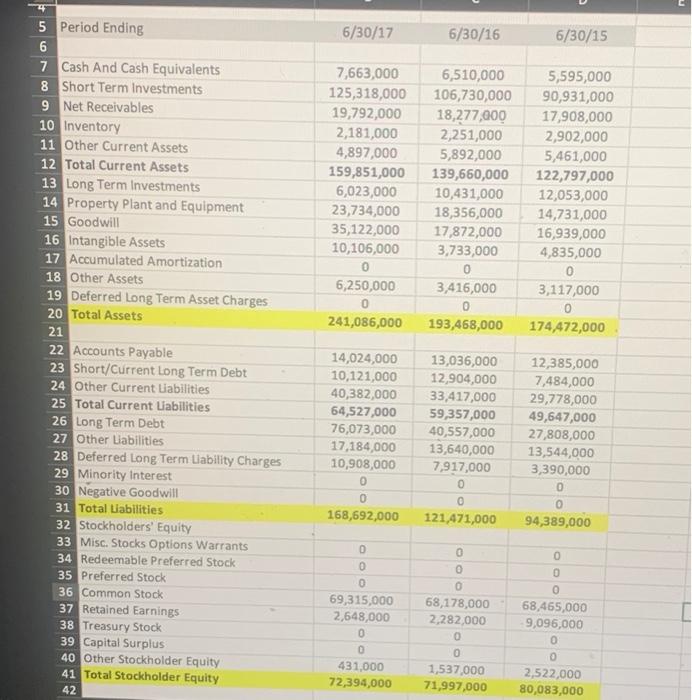
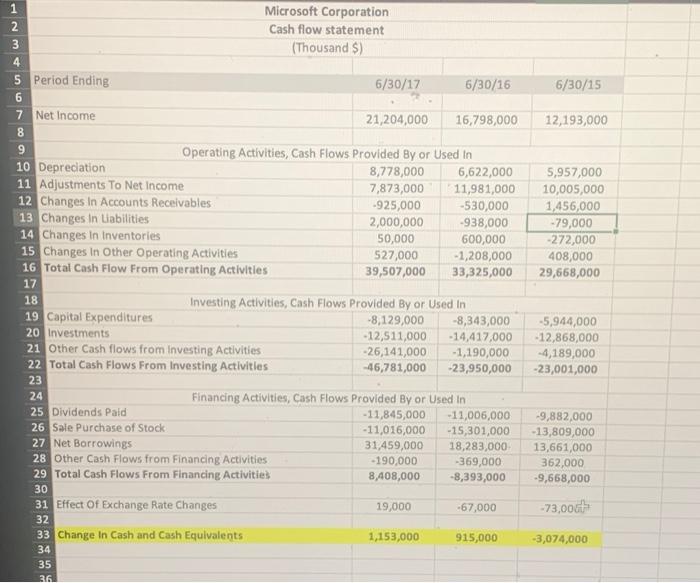
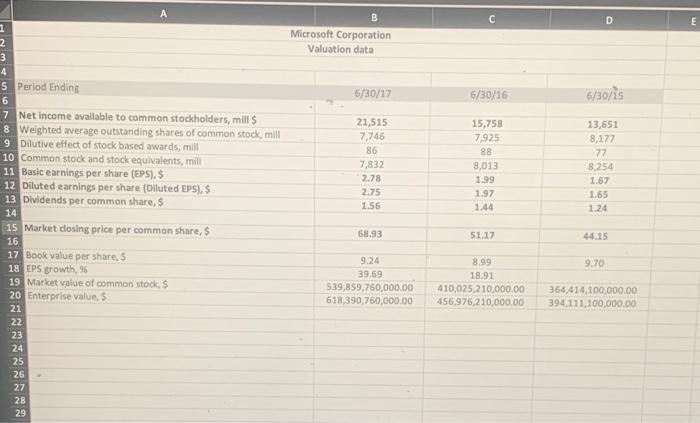
Ch 3 Case: Microsoft Financial Ratios Analysis Using the provided Excel template and Microsoft's financial statements, 1. Calculate the Microsoft financial ratios shown in the provided template. Make sure to show your work/build-in formulas in Excel). 2. Provide a time-series and a cross-sectional analysis of Microsoft's ratios using the performance descriptor labels provided in Excel 3. Provide an overall analysis of the firm's financial ratios by category, then summarize its strengths, weakness, and your recommendations on how the firm can improve its performance 4. Construct the Du Pont System of Analysis for Microsoft (a) calculate the ROE for Microsoft and the industry for 2017 using the Du Pont approach (b) evaluate Microsoft relative to the industry in profitability, activity and solvency categories of ratios (c) using the Du Pont results, explain the firm's strengths and weaknesses and provide your recommendations as to what the firm should do to improve its performance, or what areas it should investigate further. English (United States) Focus HT !! D E Industry average 2017 2015 4 50.20% 20.63% 14.40% 5.76% 5.79% 23.04% 22.81% $1.80 A B C 1 1. Using Microsoft financial data, calculate the following financial ratios 2 3 Microsoft 2017 2016 5 Profitability ratios 6 Gross profit margin 7 Operating profit margin 8 Net profit margin 9 ROA (typical) 10 ROA (accounting) 11 ROE (typical) 12 ROE (accounting) 13 Diluted EPS 14 Liquidity ratios 15 Current ratio 16 Quick ratio 17 Activity ratios 18 Asset turnover (typical) 19 Asset turnover (accounting) 20 Inventory turnover (typical) 21 Inventory turnover (accounting) 22 Average days of inventory (typical) 23 Average days of inventory (accounting) 24 Average collection period 25 Average payment period (approach 2) 26 Solvency/debt-management ratios 27 Debt to assets ratio 28 Debt to equity ratio 29 Financial leverage multiplier (FLM) 3:33 2.69 30 Market ratios 31 Market to book ratio 32 PE ratio (use diluted EPS) 1.30 1.20 0.40 0.42 14.50 14.30 25.17 25.52 80.00 85.00 75% 2009 4.00 2.18 4.38 12.96 2. Conduct time series and cross-sectional analysis age Ratio interpretation Cross-sectional Time-Series Ratio Type: Time series Cross section Possible interpration: Stable, unstable, improvine deterioratin Poor average, good 0 16 Latament Valuation data financiarato 130% Pro EE OV 33 ww 16 IT 4. Du Pont system of Analysis a) Construct the Du Pont System of Analysis for Microsoft and the industry for 2017 (do not posterations from part 1. You need to use the Du Pont system here) Net profit Awet FLM ROA, ROE% Based on 2017 margin, turnover Microsoft Industry b) Evaluate Microsoft relative to the industry in profitability, activity and solvency category Profitability Activity Solvency e Given your analysis above, what are the firm's strengths and weaknessed? What would you recommend for the them to do to improve its performance or investigate further? Strength | Weaknesses [Mecommendations Microsoft Corporation Income Statement (Thousand $) Fiscal year, ending date 6/30/17 6/30/16 6/30/15 90,000,000 34,000,000 56,000,000 85,000,000 33,500,000 51,500,000 95,000,000 33,000,000 62,000,000 13,037,000 20,020,000 306,000 11,988,000 19,260,000 1,110,000 12,046,000 20,324,000 10,011,000 22,637,000 19,142,000 19,619,000 823,000 23,460,000 -431,000 18,711,000 346,000 19,965,000 Total Revenue Cost of Revenue Gross Profit Operating Expenses Research Development Selling General and Administrative Non Recurring Others Total Operating Expenses 5 Operating Income or Loss 7 Income from Continuing Operations 8 Total Other Income/expenses Net 9 Earnings Before Interest and Taxes CO Interest Expense 21 Income Before Tax 22 Income Tax Expense 23 Minority Interest 24 Net Income From Continuing Ops 25 Non-recurring Events 26 Discontinued Operations 27 Extraordinary Items 28 Effect Of Accounting Changes 29 Other Items 30 Net Income 31 Net Income 32 Preferred Stock And Other Adjustments 33 Net Income Applicable To Common Shares 34 35 36 23,460,000 1,945,000 18,711,000 2,953,000 19,965,000 6,314,000 21,515,000 15,758,000 13,651,000 21,515,000 15,758,000 13,651,000 21,515,000 15,758,000 13,651,000 6/30/17 6/30/16 6/30/15 7,663,000 125,318,000 19,792,000 2,181,000 4,897,000 159,851,000 6,023,000 23,734,000 35,122,000 10,106,000 6,510,000 106,730,000 18,277,000 2,251,000 5,892,000 139,660,000 10,431,000 18,356,000 17,872,000 3,733,000 0 3,416,000 5,595,000 90,931,000 17,908,000 2,902,000 5,461,000 122,797,000 12,053,000 14,731,000 16,939,000 4,835,000 0 3,117,000 6,250,000 0 241,086,000 193,468,000 174,472,000 5 Period Ending 6 7 Cash And Cash Equivalents 8 Short Term Investments 9 Net Receivables 10 Inventory 11 Other Current Assets 12 Total Current Assets 13 Long Term Investments 14 Property Plant and Equipment 15 Goodwill 16 Intangible Assets 17 Accumulated Amortization 18 Other Assets 19 Deferred Long Term Asset Charges 20 Total Assets 21 22 Accounts Payable 23 Short/Current Long Term Debt 24 Other Current Liabilities 25 Total Current Labilities 26 Long Term Debt 27 Other Liabilities 28 Deferred Long Term Liability Charges 29 Minority Interest 30 Negative Goodwill 31 Total Liabilities 32 Stockholders' Equity 33 Misc. Stocks Options Warrants 34 Redeemable Preferred Stock 35 Preferred Stock 36 Common Stock 37 Retained Earnings 38 Treasury Stock 39 Capital Surplus 40 Other Stockholder Equity 41 Total Stockholder Equity 42 14,024,000 10,121,000 40,382,000 64,527,000 76,073,000 17,184,000 10,908,000 0 0 168,692,000 13,036,000 12,904,000 33,417,000 59,357,000 40,557,000 13,640,000 7,917,000 0 0 121,471,000 12,385,000 7,484,000 29,778,000 49,647,000 27,808,000 13,544,000 3,390,000 0 0 94,389,000 OO 0 0 0 69,315,000 2,648,000 0 0 431,000 72,394,000 68,178,000 2,282,000 0 0 1,537,000 71,997,000 0 0 0 68,465,000 9,096,000 0 2,522,000 80,083,000 6/30/15 12,193,000 5,957,000 10,005,000 1,456,000 -79,000 -272,000 408,000 29,668,000 1 Microsoft Corporation 2 Cash flow statement 3 (Thousand S) 4 5 Period Ending 6/30/17 6/30/16 6 7 Net Income 21,204,000 16,798,000 8 9 Operating Activities, Cash Flows Provided By or Used In 10 Depreciation 8,778,000 6,622,000 11 Adjustments To Net Income 7,873,000 11,981,000 12 Changes in Accounts Receivables -925,000 -530,000 13 Changes in Liabilities 2,000,000 -938,000 14 Changes in Inventories 50,000 600,000 15 Changes in Other Operating Activities 527,000 -1,208,000 16 Total Cash Flow From Operating Activities 39,507,000 33,325,000 17 18 Investing Activities, Cash Flows Provided By or Used in 19 Capital Expenditures -8,129,000 -8,343,000 20 Investments -12,511,000 -14,417,000 21 Other Cash flows from Investing Activities -26,141,000 -1,190,000 22 Total Cash Flows From Investing Activities -46,781,000 -23,950,000 23 24 Financing Activities, Cash Flows Provided By or Used In 25 Dividends Paid -11,845,000 -11,006,000 26 Sale Purchase of Stock -11,016,000 -15,301,000 27 Net Borrowings 31,459,000 18,283,000 28 Other Cash Flows from Financing Activities -190,000 -369,000 29 Total Cash Flows From Financing Activities 8,408,000 -8,393,000 30 31 Effect Of Exchange Rate Changes 19,000 -67,000 32 33 Change in Cash and Cash Equivalents 1,153,000 915,000 34 35 -5,944,000 -12,868,000 -4,189,000 -23,001,000 -9,882,000 -13,809,000 13,661,000 362,000 -9,668,000 -73,000h -3,074,000 36 D E B Microsoft Corporation Valuation data 6/30/17 6/30/16 6/30/15 21,515 7,746 86 7,832 2.78 2.75 1.56 15,758 7.925 88 8,013 1.99 1.97 1.44 13,651 8,177 77 8.254 1.67 1.65 1.24 1 2 3 4 5 Period Ending 6 7 Net income available to common stockholders, mill 8 Weighted average outstanding shares of common stock, mill 9 Dilutive effect of stock based awards, mill 10 common stock and stock equivalents, mill 11 Basic earnings per share (EPS), 12 Diluted earnings per share (Olluted EPS), $ 13 Dividends per common share, 5 14 15 Market closing price per common share, $ 16 17 Book value per share, 5 18 EPS growth, 19 Market value of common stocks 20 Enterprise value, s 21 22 23 24 25 26 27 28 29 68.93 51.17 44.15 9.70 9.24 39.69 539,859,750,000.00 618 390,760,000.00 8.99 18.91 410,025,210,000.00 456,976,210,000.00 364,414,100,000.00 394,111,100,000.00 Ch 3 Case: Microsoft Financial Ratios Analysis Using the provided Excel template and Microsoft's financial statements, 1. Calculate the Microsoft financial ratios shown in the provided template. Make sure to show your work/build-in formulas in Excel). 2. Provide a time-series and a cross-sectional analysis of Microsoft's ratios using the performance descriptor labels provided in Excel 3. Provide an overall analysis of the firm's financial ratios by category, then summarize its strengths, weakness, and your recommendations on how the firm can improve its performance 4. Construct the Du Pont System of Analysis for Microsoft (a) calculate the ROE for Microsoft and the industry for 2017 using the Du Pont approach (b) evaluate Microsoft relative to the industry in profitability, activity and solvency categories of ratios (c) using the Du Pont results, explain the firm's strengths and weaknesses and provide your recommendations as to what the firm should do to improve its performance, or what areas it should investigate further. English (United States) Focus HT !! D E Industry average 2017 2015 4 50.20% 20.63% 14.40% 5.76% 5.79% 23.04% 22.81% $1.80 A B C 1 1. Using Microsoft financial data, calculate the following financial ratios 2 3 Microsoft 2017 2016 5 Profitability ratios 6 Gross profit margin 7 Operating profit margin 8 Net profit margin 9 ROA (typical) 10 ROA (accounting) 11 ROE (typical) 12 ROE (accounting) 13 Diluted EPS 14 Liquidity ratios 15 Current ratio 16 Quick ratio 17 Activity ratios 18 Asset turnover (typical) 19 Asset turnover (accounting) 20 Inventory turnover (typical) 21 Inventory turnover (accounting) 22 Average days of inventory (typical) 23 Average days of inventory (accounting) 24 Average collection period 25 Average payment period (approach 2) 26 Solvency/debt-management ratios 27 Debt to assets ratio 28 Debt to equity ratio 29 Financial leverage multiplier (FLM) 3:33 2.69 30 Market ratios 31 Market to book ratio 32 PE ratio (use diluted EPS) 1.30 1.20 0.40 0.42 14.50 14.30 25.17 25.52 80.00 85.00 75% 2009 4.00 2.18 4.38 12.96 2. Conduct time series and cross-sectional analysis age Ratio interpretation Cross-sectional Time-Series Ratio Type: Time series Cross section Possible interpration: Stable, unstable, improvine deterioratin Poor average, good 0 16 Latament Valuation data financiarato 130% Pro EE OV 33 ww 16 IT 4. Du Pont system of Analysis a) Construct the Du Pont System of Analysis for Microsoft and the industry for 2017 (do not posterations from part 1. You need to use the Du Pont system here) Net profit Awet FLM ROA, ROE% Based on 2017 margin, turnover Microsoft Industry b) Evaluate Microsoft relative to the industry in profitability, activity and solvency category Profitability Activity Solvency e Given your analysis above, what are the firm's strengths and weaknessed? What would you recommend for the them to do to improve its performance or investigate further? Strength | Weaknesses [Mecommendations Microsoft Corporation Income Statement (Thousand $) Fiscal year, ending date 6/30/17 6/30/16 6/30/15 90,000,000 34,000,000 56,000,000 85,000,000 33,500,000 51,500,000 95,000,000 33,000,000 62,000,000 13,037,000 20,020,000 306,000 11,988,000 19,260,000 1,110,000 12,046,000 20,324,000 10,011,000 22,637,000 19,142,000 19,619,000 823,000 23,460,000 -431,000 18,711,000 346,000 19,965,000 Total Revenue Cost of Revenue Gross Profit Operating Expenses Research Development Selling General and Administrative Non Recurring Others Total Operating Expenses 5 Operating Income or Loss 7 Income from Continuing Operations 8 Total Other Income/expenses Net 9 Earnings Before Interest and Taxes CO Interest Expense 21 Income Before Tax 22 Income Tax Expense 23 Minority Interest 24 Net Income From Continuing Ops 25 Non-recurring Events 26 Discontinued Operations 27 Extraordinary Items 28 Effect Of Accounting Changes 29 Other Items 30 Net Income 31 Net Income 32 Preferred Stock And Other Adjustments 33 Net Income Applicable To Common Shares 34 35 36 23,460,000 1,945,000 18,711,000 2,953,000 19,965,000 6,314,000 21,515,000 15,758,000 13,651,000 21,515,000 15,758,000 13,651,000 21,515,000 15,758,000 13,651,000 6/30/17 6/30/16 6/30/15 7,663,000 125,318,000 19,792,000 2,181,000 4,897,000 159,851,000 6,023,000 23,734,000 35,122,000 10,106,000 6,510,000 106,730,000 18,277,000 2,251,000 5,892,000 139,660,000 10,431,000 18,356,000 17,872,000 3,733,000 0 3,416,000 5,595,000 90,931,000 17,908,000 2,902,000 5,461,000 122,797,000 12,053,000 14,731,000 16,939,000 4,835,000 0 3,117,000 6,250,000 0 241,086,000 193,468,000 174,472,000 5 Period Ending 6 7 Cash And Cash Equivalents 8 Short Term Investments 9 Net Receivables 10 Inventory 11 Other Current Assets 12 Total Current Assets 13 Long Term Investments 14 Property Plant and Equipment 15 Goodwill 16 Intangible Assets 17 Accumulated Amortization 18 Other Assets 19 Deferred Long Term Asset Charges 20 Total Assets 21 22 Accounts Payable 23 Short/Current Long Term Debt 24 Other Current Liabilities 25 Total Current Labilities 26 Long Term Debt 27 Other Liabilities 28 Deferred Long Term Liability Charges 29 Minority Interest 30 Negative Goodwill 31 Total Liabilities 32 Stockholders' Equity 33 Misc. Stocks Options Warrants 34 Redeemable Preferred Stock 35 Preferred Stock 36 Common Stock 37 Retained Earnings 38 Treasury Stock 39 Capital Surplus 40 Other Stockholder Equity 41 Total Stockholder Equity 42 14,024,000 10,121,000 40,382,000 64,527,000 76,073,000 17,184,000 10,908,000 0 0 168,692,000 13,036,000 12,904,000 33,417,000 59,357,000 40,557,000 13,640,000 7,917,000 0 0 121,471,000 12,385,000 7,484,000 29,778,000 49,647,000 27,808,000 13,544,000 3,390,000 0 0 94,389,000 OO 0 0 0 69,315,000 2,648,000 0 0 431,000 72,394,000 68,178,000 2,282,000 0 0 1,537,000 71,997,000 0 0 0 68,465,000 9,096,000 0 2,522,000 80,083,000 6/30/15 12,193,000 5,957,000 10,005,000 1,456,000 -79,000 -272,000 408,000 29,668,000 1 Microsoft Corporation 2 Cash flow statement 3 (Thousand S) 4 5 Period Ending 6/30/17 6/30/16 6 7 Net Income 21,204,000 16,798,000 8 9 Operating Activities, Cash Flows Provided By or Used In 10 Depreciation 8,778,000 6,622,000 11 Adjustments To Net Income 7,873,000 11,981,000 12 Changes in Accounts Receivables -925,000 -530,000 13 Changes in Liabilities 2,000,000 -938,000 14 Changes in Inventories 50,000 600,000 15 Changes in Other Operating Activities 527,000 -1,208,000 16 Total Cash Flow From Operating Activities 39,507,000 33,325,000 17 18 Investing Activities, Cash Flows Provided By or Used in 19 Capital Expenditures -8,129,000 -8,343,000 20 Investments -12,511,000 -14,417,000 21 Other Cash flows from Investing Activities -26,141,000 -1,190,000 22 Total Cash Flows From Investing Activities -46,781,000 -23,950,000 23 24 Financing Activities, Cash Flows Provided By or Used In 25 Dividends Paid -11,845,000 -11,006,000 26 Sale Purchase of Stock -11,016,000 -15,301,000 27 Net Borrowings 31,459,000 18,283,000 28 Other Cash Flows from Financing Activities -190,000 -369,000 29 Total Cash Flows From Financing Activities 8,408,000 -8,393,000 30 31 Effect Of Exchange Rate Changes 19,000 -67,000 32 33 Change in Cash and Cash Equivalents 1,153,000 915,000 34 35 -5,944,000 -12,868,000 -4,189,000 -23,001,000 -9,882,000 -13,809,000 13,661,000 362,000 -9,668,000 -73,000h -3,074,000 36 D E B Microsoft Corporation Valuation data 6/30/17 6/30/16 6/30/15 21,515 7,746 86 7,832 2.78 2.75 1.56 15,758 7.925 88 8,013 1.99 1.97 1.44 13,651 8,177 77 8.254 1.67 1.65 1.24 1 2 3 4 5 Period Ending 6 7 Net income available to common stockholders, mill 8 Weighted average outstanding shares of common stock, mill 9 Dilutive effect of stock based awards, mill 10 common stock and stock equivalents, mill 11 Basic earnings per share (EPS), 12 Diluted earnings per share (Olluted EPS), $ 13 Dividends per common share, 5 14 15 Market closing price per common share, $ 16 17 Book value per share, 5 18 EPS growth, 19 Market value of common stocks 20 Enterprise value, s 21 22 23 24 25 26 27 28 29 68.93 51.17 44.15 9.70 9.24 39.69 539,859,750,000.00 618 390,760,000.00 8.99 18.91 410,025,210,000.00 456,976,210,000.00 364,414,100,000.00 394,111,100,000.00