Answered step by step
Verified Expert Solution
Question
1 Approved Answer
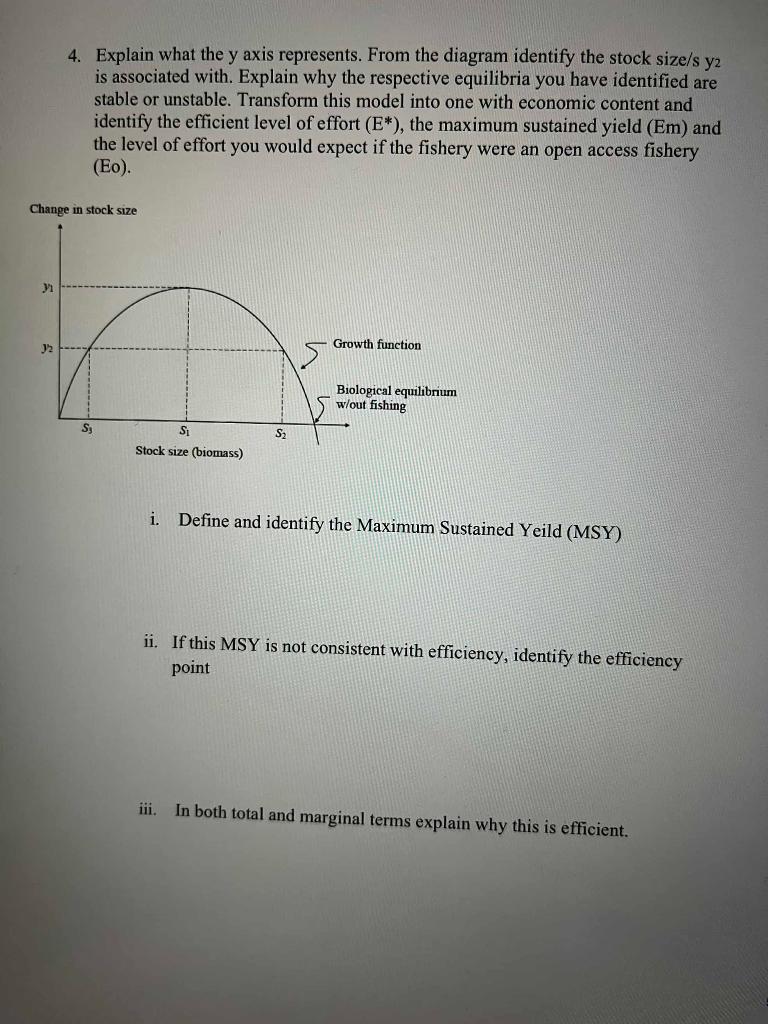
Change in stock size 31 4. Explain what the y axis represents. From the diagram identify the stock size/s y2 is associated with. Explain

Change in stock size 31 4. Explain what the y axis represents. From the diagram identify the stock size/s y2 is associated with. Explain why the respective equilibria you have identified are stable or unstable. Transform this model into one with economic content and identify the efficient level of effort (E*), the maximum sustained yield (Em) and the level of effort you would expect if the fishery were an open access fishery (Eo). 32 S D S S Stock size (biomass) Growth function Biological equilibrium w/out fishing i. Define and identify the Maximum Sustained Yeild (MSY) ii. If this MSY is not consistent with efficiency, identify the efficiency point iii. In both total and marginal terms explain why this is efficient.
Step by Step Solution
★★★★★
3.45 Rating (142 Votes )
There are 3 Steps involved in it
Step: 1
Breakdown of the Diagram and Model Analysis 1 Yaxis The yaxis represents the stock size biomass of the fish population This indicates the total weight or number of fish in the population at any given ...
Get Instant Access to Expert-Tailored Solutions
See step-by-step solutions with expert insights and AI powered tools for academic success
Step: 2

Step: 3

Ace Your Homework with AI
Get the answers you need in no time with our AI-driven, step-by-step assistance
Get Started


