

Question
Chapt 5: Below is the ER diagram that demonstrates how many queries (by hourly average) that interact with each entity at a hospital. 1)Convert the
Chapt 5: Below is the ER diagram that demonstrates how many queries (by hourly average) that interact with each entity at a hospital.
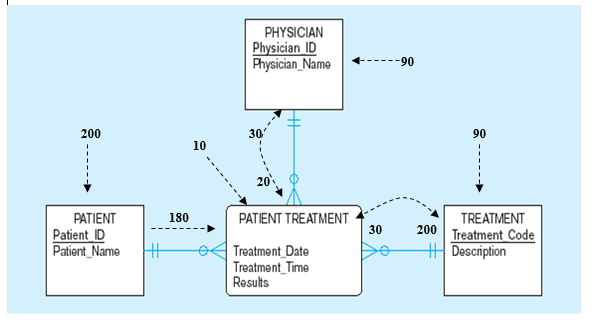
1)Convert the above ER diagram to relations in 3NF (in the graphical or textual schema format)
2)Assuming that each relation in your answer to problem 1 is relatively large, what should you do to improve the system responsiveness to users queries? In other words, analyze the query traffic and make decision which relations should be denormailized (or merged). Show your calculation in the table below and demonstrate the denormalized relations in graphical or textual schema.
2.1 Show your query analysis here.
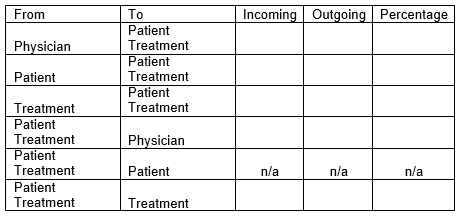
2.2 Explain which relations should be denormalized and why.
2.3 Show the denormalized relations in graphical or textual schema.
PHYSICIAN Physician ID Physician -90 200 30 90 10 20 PATIENT Patient ID Patient Name 41 TREATMENT 200 Treatment Code Desciption 180 PATIENT TREATMENT 30 Treatment Date Treatment Time ResultsStep by Step Solution
There are 3 Steps involved in it
Step: 1

Get Instant Access to Expert-Tailored Solutions
See step-by-step solutions with expert insights and AI powered tools for academic success
Step: 2

Step: 3
Ace Your Homework with AI
Get the answers you need in no time with our AI-driven, step-by-step assistance
Get Started
Database Administration The Complete Guide To Dba Practices And Procedures
Authors: Craig S. Mullins
2nd Edition
0321822943, 978-0321822949