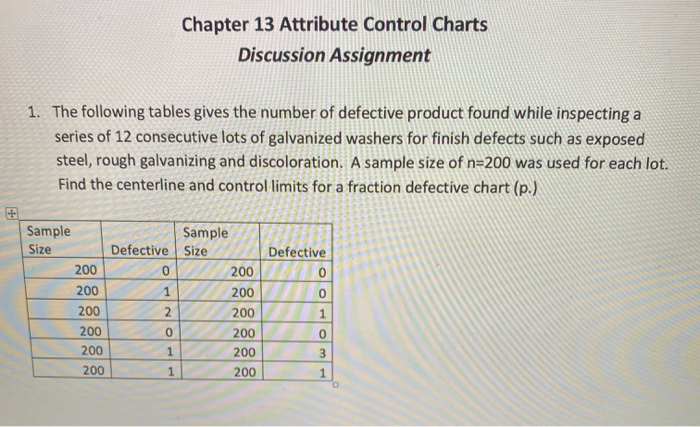
Question: Chapter 13 Attribute Control Charts Discussion Assignment 1. The following tables gives the number of defective product found while inspecting a series of 12 consecutive

Chapter 13 Attribute Control Charts Discussion
Chapter 13 Attribute Control Charts Discussion Assignment 1. The following tables gives the number of defective product found while inspecting a series of 12 consecutive lots of galvanized washers for finish defects such as exposed steel, rough galvanizing and discoloration. A sample size of n=200 was used for each lot. Find the centerline and control limits for a fraction defective chart (p.) Size Defective Sample Sample Defective Size e 200 0 200 200 1 200 200 2 200 200 0 200 200 1 200 2001 200 OOD 2. For the following information, create an np control chart: no np Sample size 50 Sample np size 550 12 Sample size 50 50 50 50 50 50 50 18 15 8 6 17. 50 50 10 12 50 22 8 50 24 50 15 50 50 12 50 7 50 13 509 50 6 50 50 50 16 9 10 14 50 50 1050 12 3. A production line manufacturers compact discs. Twice an hour, one CD is selected at random from those made during the hour. Each disc is inspected separately for imperfections (defects,) such as scratches, nicks, discolorations and dents. The resulting count of imperfections from each disc is recorded on a control chart. Use the following data to create a c chart. Hour Imperfections Hour Imperfections 12 Hour Imperfections 2112 22 0 232 241 13 0 15 25 6 7 18 17 2 10 4. When printing full color glossy magazine advertising pages, editors do not like to see blemishes or pics (very small places where the color did not transfer to the paper.) One person at the printer has the job of looking at samples of magazine pages (n=20) and counting blemishes. Below are her results. The editors are interested in plotting the defects per unit on a u chart. Determine the centerline and control limits. Create a chart of this process. If the editors want only two defects per unit on average. How does this compare with the actual process average? Subgroup number Count of defects Subgroup number Count of defects 65 42 80 35 60 RE on 52

Step by Step Solution

There are 3 Steps involved in it

1 Expert Approved Answer
Step: 1 Unlock blur-text-image
Question Has Been Solved by an Expert!

Get step-by-step solutions from verified subject matter experts

Step: 2 Unlock
Step: 3 Unlock

Students Have Also Explored These Related General Management Questions!