

Answered step by step
Verified Expert Solution
Question
1 Approved Answer
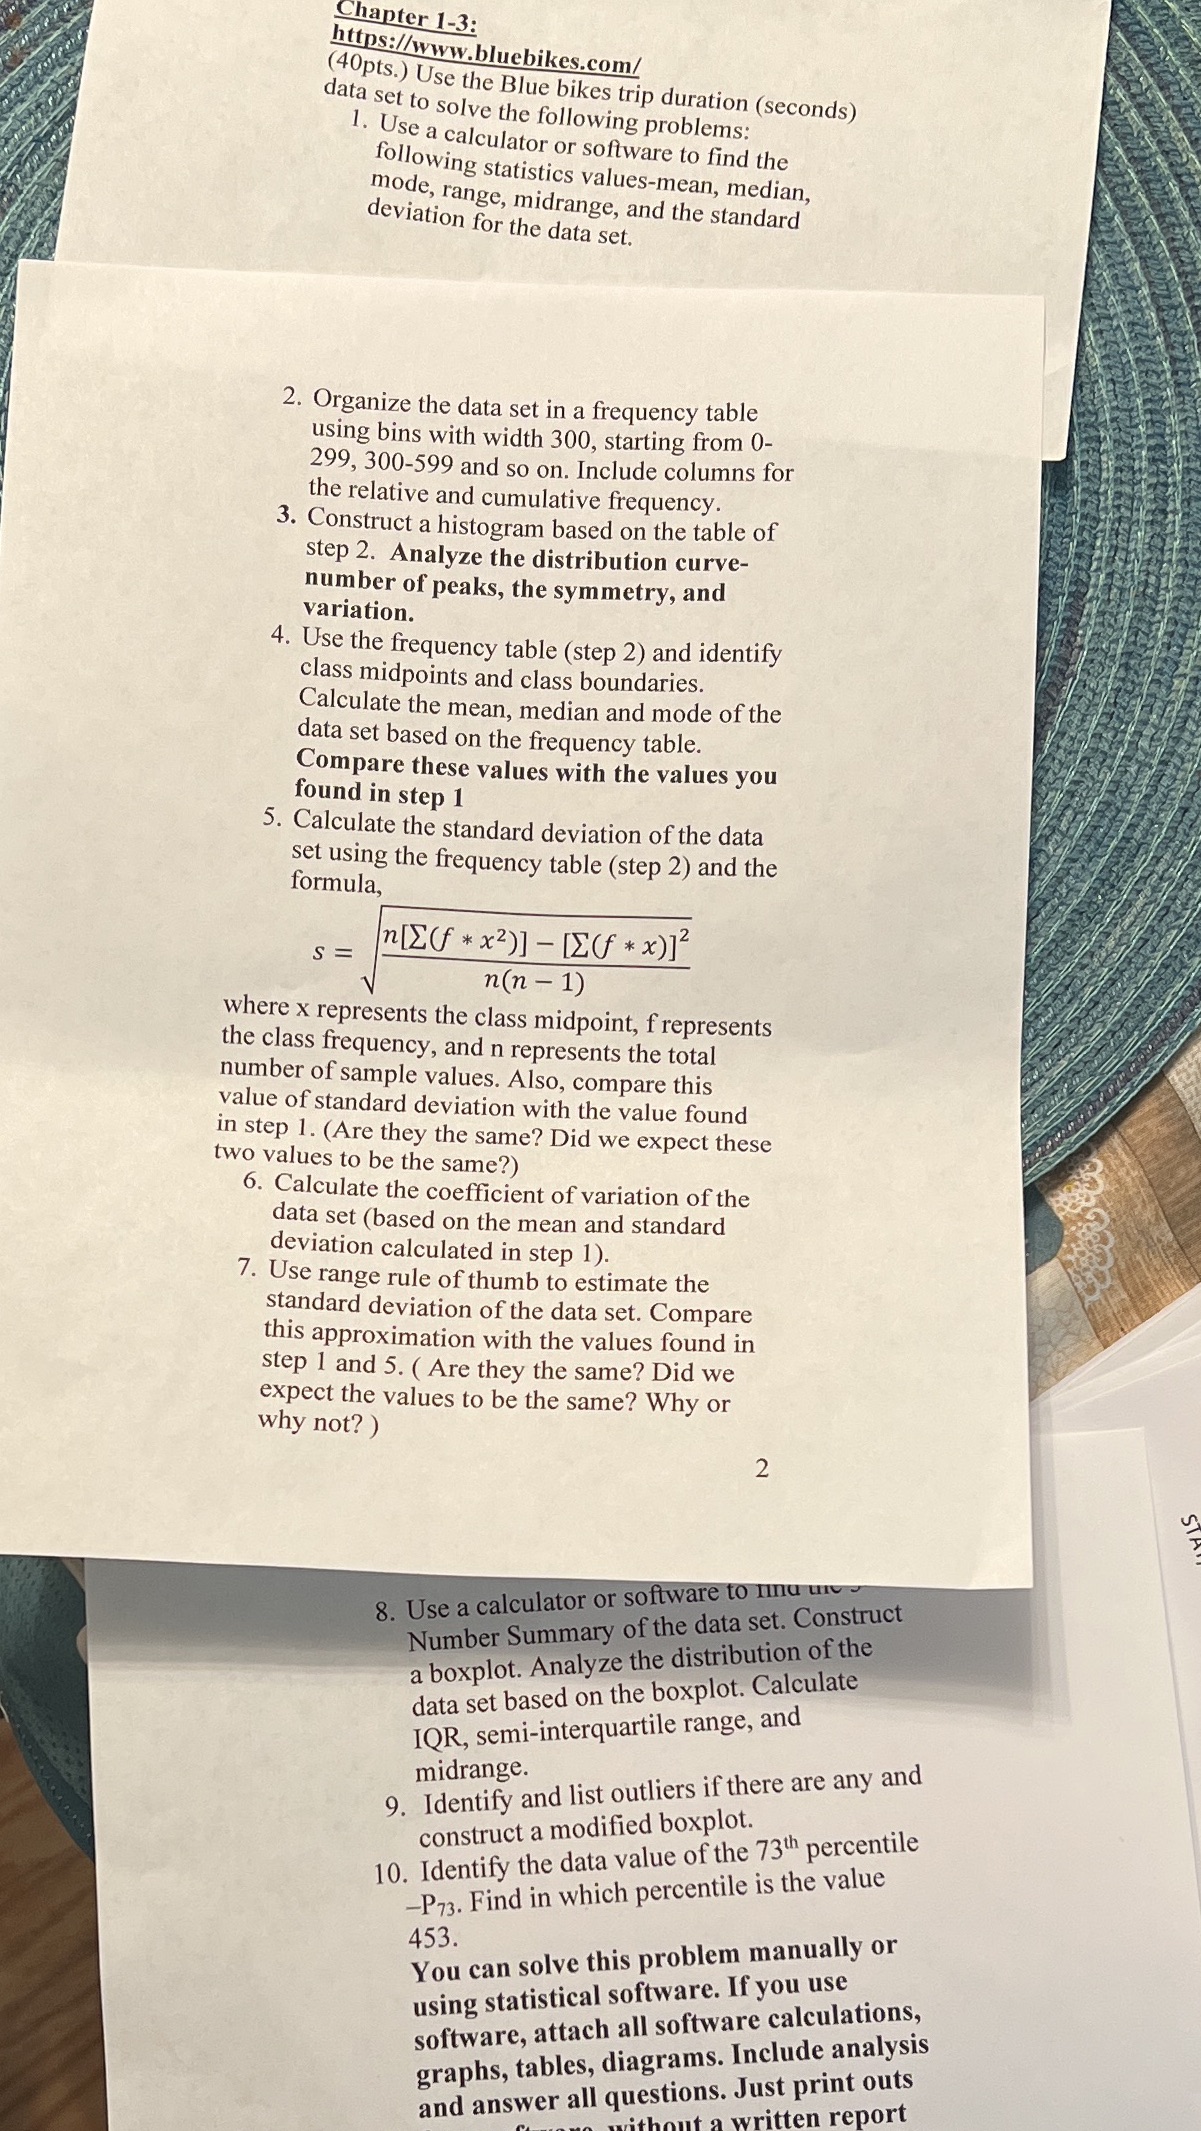
Chapter 1-3: https://www.bluebikes.com/ (40pts.) Use the Blue bikes trip duration (seconds) data set to solve the following problems: 1. Use a calculator or software to
Step by Step Solution
There are 3 Steps involved in it
Step: 1

Get Instant Access to Expert-Tailored Solutions
See step-by-step solutions with expert insights and AI powered tools for academic success
Step: 2

Step: 3
Ace Your Homework with AI
Get the answers you need in no time with our AI-driven, step-by-step assistance
Get Started
Differential Equations With Boundary-Value Problems
Authors: Dennis G Zill, Ellen Monk, Warren S Wright
8th Edition
1285401298, 9781285401294